Gold is an underrated asset. Gold also hit a new all-time high (“ATH”), recently surging to around $2,150. While the market may believe that current gold prices are unsustainable, the fundamental backdrop is highly favorable, and the yellow metal could go much higher. In addition to constructive fundamental factors, the technical image is bullish, and improving sentiment could send gold prices and gold stocks to substantially higher levels next year.
Many high-quality gold stocks trade at low multiples, and their future earnings estimates appear predicated on a lower or falling gold price. Gold is establishing a foothold above $2,000 as the Fed transitions to an easier monetary stance, creating a more accessible financial environment in future years. Gold tends to outperform during easing cycles, and the reason gold held up so well during the recent tightening process was rampant inflation.
The gold market looks forward to a growing economy and an expanding monetary base. Moreover, the gold market looks forward to the next round of inflation. Deflation is likely the only thing that could keep gold prices down. However, a soft landing scenario implies the economy could skirt a recession. This dynamic means that gold could break out soon, moving to new ATHs from here.
Gold – A Breakout 12 Years In The Making
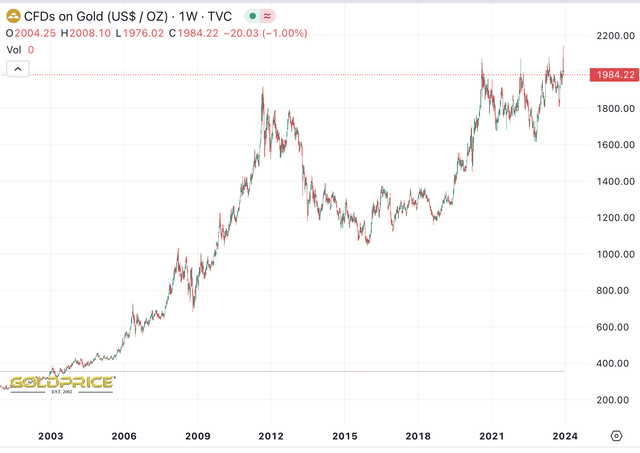
Gold price (goldprice.org)
Note the Super-bullish long-term cup and handle pattern.
Gold first attempted to reach the $2K level in late 2011. I remember it like yesterday. I watched gold skyrocket to over $1,900 as I sat in a diner in Maine, staring at my laptop that late summer season.
I was long gold then and quite a bit of silver (quintupled in about 2.5 years). From a longer-term perspective, gold had a massive move, appreciating from around $200 to over $1,000 during the “original” house market bubble, enabling a Greenspan-led easy monetary era in the early to mid-2000s.
Then gold got a massive boost after dropping briefly to around $700 because of deflation fears. Then, the helicopter-Ben, post-financial crisis easing era, made gold skyrocket, nearly tripling from its 2008 low in just under three years.
Of course, prices increased too quickly after nearly a 10x return in about ten years. Therefore, we had massive profit-taking and short positioning, resulting in a long-term bear market that took several years to clear. The primary fundamental reason behind the enormous selloff was the expectation that the Fed would unload its balance sheet, returning the economy to growth under a “normalized” monetary regime.
But The Fed May Never Unload Its Balance Sheet
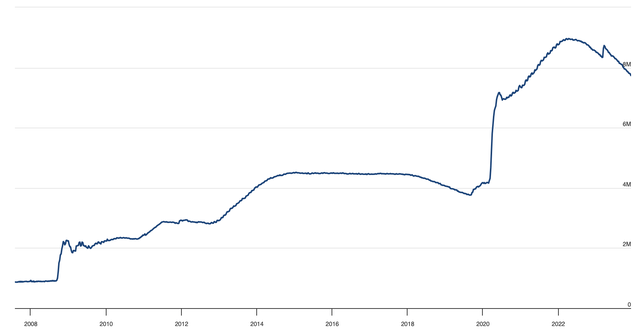
Fed’s balance sheet (Federalreserve.gov)
This period reminds me of the 2014-2018 tightening time frame. The process was slow-motion then, and now everything is being sped up. In short, the Fed tightens, and after some time, the economy begins buckling beneath the pressure of high rates.
The truth is that the Fed may never unload its balance sheet. We’ve become accustomed to an easy monetary economy, and there isn’t a simple road back. First, we must mention that debt has skyrocketed. The national debt is around $34 trillion, roughly 122% of GDP. Compared to other periods, the government debt was approximately 55% of GDP in 2000 and below 35% in 1980.
Also, it’s not just government. Many forms of debt are exploding to new heights. Look at credit cards, mortgages, student loans, car loans, etc. However, the national debt is alarming, and the government deficit is now nearly $2T. The estimated annual servicing payment on the $34T national debt is an estimated $1T, staggering. Yes, the U.S. now “spends” (more like waste) $1T to service its debt. How is this sustainable, and for how long? No one knows precisely, but it could end badly.
The primary reason why government debt servicing payments have grown astronomically is because of high interest rates. When treasury yields are 1.5% instead of 5%, the U.S. pays much less premium to service its debt. At the same time, I’m primarily discussing the government’s debt, a similar principle concerning most debt that permeates every layer of our economy.
Our consumer-driven, heavily debt-based economy cannot withstand an elevated interest rate environment for long. We saw the economy buckle toward the end of 2018 after the Fed introduced a tighter monetary atmosphere for several years. This time, the Fed jacked rates up even higher, and the economy has been resilient. However, it won’t last long. The warning signs are all around us, and the Fed needs to lower rates soon.
The Fed Likely To Drop Rates Early Next Year
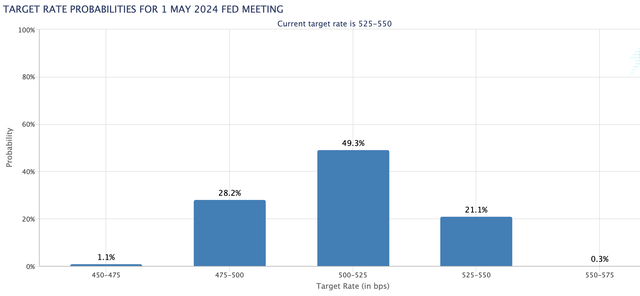
Rate probabilities (CMEGroup.com)
There is an overwhelming (79% probability) that the Fed will lower interest rates by at least a quarter point or more by May next year. We may even get the first-rate decrease at the March FOMC meeting, and probabilities will move higher if unemployment increases. Moreover, continued progress on inflation and other variables should enable the Fed to consider dropping rates sooner rather than later, a dynamic highly favorable for gold.
Gold: 5-Year Chart – Price Likely Going Much Higher
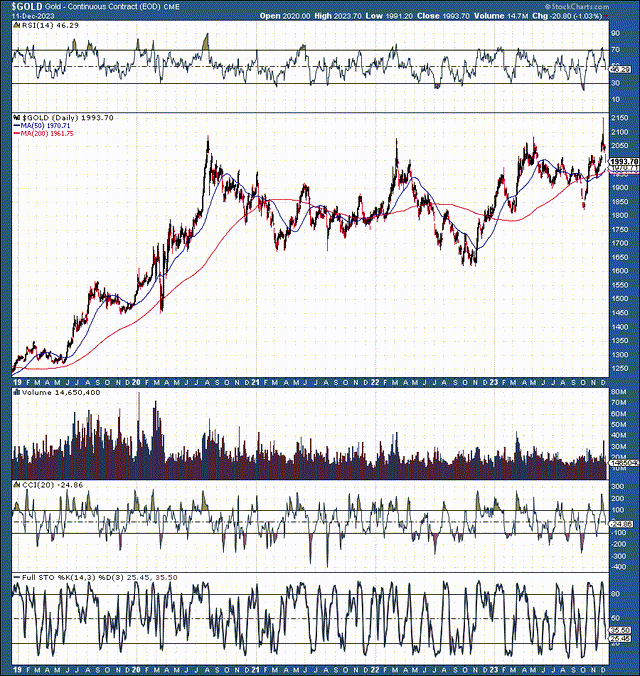
Gold 5 year price (StockCharts.com )
Once gold moves decisively above $2,000, no technical factors prevent the price from melting up. Also, the constructive fundamental backdrop should boost sentiment, compounding the effect and enabling gold to move substantially higher in future years. This breakout has been a long time coming, and gold’s price has not changed much over the last decade.
Gold delivered nearly a 10x return during the 2001-2011 time frame. However, the price of gold was essentially flat during the next ten years. Gold’s price still looks like the market expects gold prices to go lower, but the opposite will probably occur. Gold could have a significant breakout, with its price likely surging to $2,500 or higher in 2024/2025 as the Fed adopts a more accommodating monetary stance.
My Top Three Gold Miners That Could Skyrocket
Many analysts are still behind the curve on gold, expecting stagnant or lower gold prices in future years. Instead, I see a significant breakout, which should enable top gold miners to grow revenues much more rapidly than expected, expanding profitability considerably.
1. Barrick Gold (GOLD) – Barrick is one of the most significant gold miners globally. The average AISC is around $1,300-$1,400 globally. As gold breaks out above $2,000, Barrick and other high-quality gold miners should make much more money than anticipated.
Barrick Likely to Continue Beating The Estimates
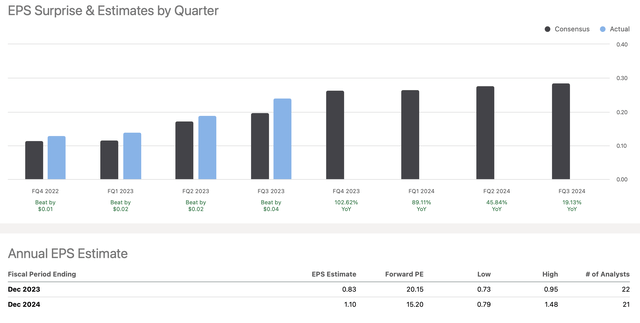
EPS growth (SeekingAlpha.com )
Barrick provided 70 cents in EPS vs. the 61-cent consensus estimate in the TTM. This dynamic represents a 15% beat rate over the forecast, and the outperformance could accelerate. There are no positive earnings revisions, and once gold’s price breaks out above $2,000, widespread upward revisions could send Barrick’s share price much higher.
Consensus EPS estimates are $1.10 in 2024, but if Barrick achieves a 20% beat rate, EPS could be around $1.32. Also, higher-end bullish estimates go up to almost $1.50, implying that some analysts and the market are catching on to the idea that we may see sustainably higher gold prices in future years.
With Barrick’s stock around $16, $1.32 in EPS suggests Barrick trades around 12 times forward earnings here. Moreover, momentum could propel gold prices higher for years. Also, corporate optimization and economies of scale could keep AISC below $1,500 for years for top gold producers. Therefore, Barrick and other high-quality firms could see substantial EPS growth for years. However, this is much different from what the estimates say.
Depressed EPS and Revenue Estimates
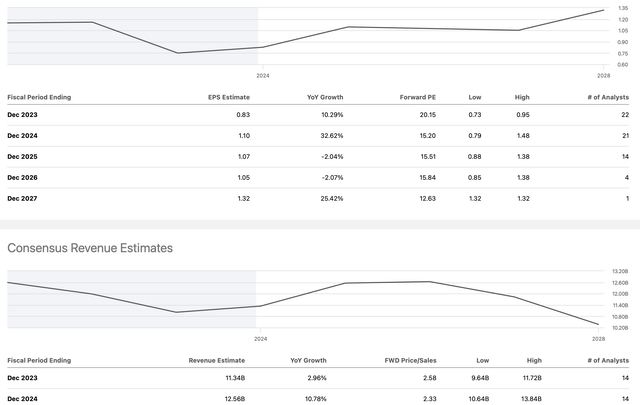
EPS and revenue estimates (SeekingAlpha.com )
Many analysts are not factoring much, if any, earnings growth into their estimates. Additionally, there are few revenue growth forecasts, with the consensus revenue curve dropping after 2025. It’s challenging to imagine why Barrick would experience a revenue dropoff if gold moves decisively above $2,000 in future years. On the contrary, revenue growth could persist and accelerate as gold prices proceed higher from here.
Barrick’s Undervalued Stock Price
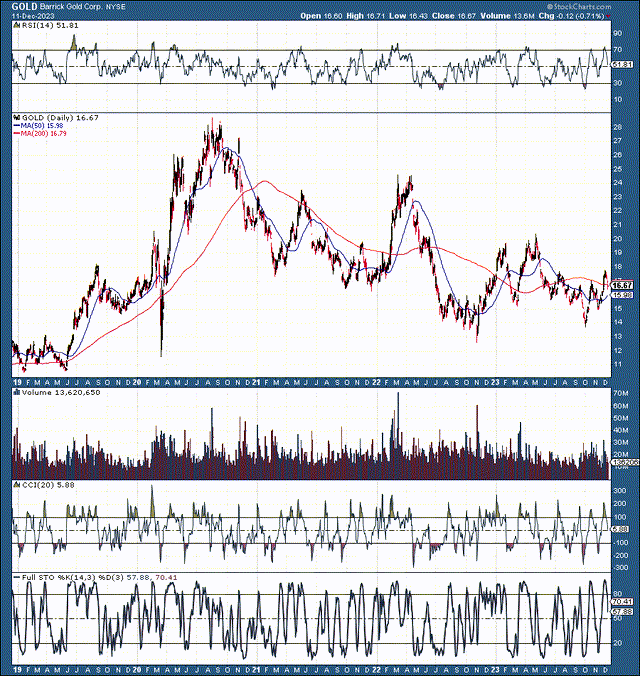
GOLD (Barrick) (StockCharts.com )
Despite gold being around an ATH, Barrick’s stock price is still around 40% below its high in 2020. Additionally, Barrick is much lower than its 2011 ATH, above $50. Once the market realizes gold can have a sustainable move above $2,000, it’s likely to push Barrick above $20 and substantially higher. Moreover, future earnings growth and upward revisions should provide support, pushing prices to new highs for Barrick. We should see a similar dynamic with other high-quality gold mining shares.
2. Agnico Eagle Mines (AEM) is another high-quality gold miner well below its ATH around $80. AEM has also outperformed recent EPS estimates, and forward EPS seems highly depressed. Instead of the $2.30 2024 consensus EPS estimate, AEM could earn closer to the $3 higher-end forecast. This dynamic implies that AEM could be trading around a 16 forward P/E here, and its stock may move much higher with higher earnings revisions due to the rising price of gold. In addition to having substantial upside potential, AEM pays a hefty 3.2% dividend.
3. Kinross Gold (KGC) is another significant gold producer that is substantially undervalued right now. Despite gold prices around ATHs, EPS revisions have decreased sharply since the 2020 highs and have not moved up yet.
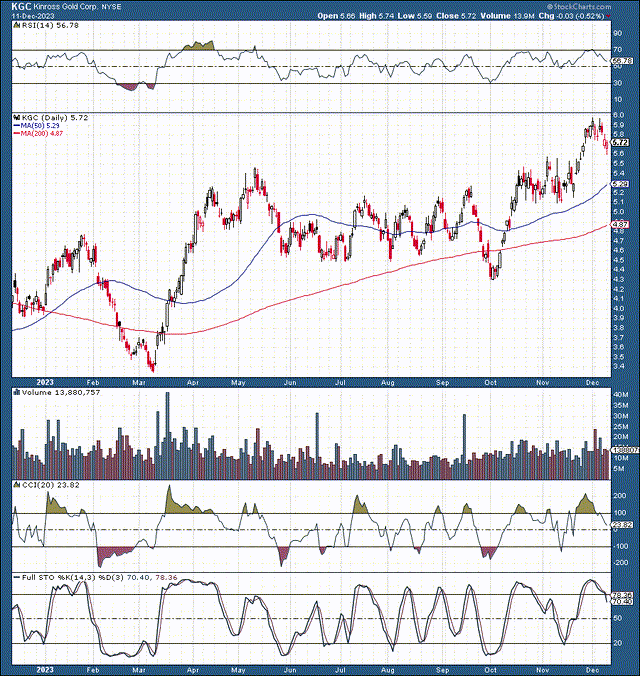
KGC (StockCharts.com )
Kinross stock’s price action has improved considerably since the start of the year. The stock is ahead of analysts, establishing a powerful uptrend before upward revisions are made. Still, KGC trades at only 14 times this year’s EPS estimates, and forward EPS expectations will likely get revised higher with the rising price of gold.
2024 Year-end Estimates
- Gold: $2,500
- Barrick Gold: $30-$35
- Anglico Eagle Mines: $80-$100
- Kinross Gold: $12-$15
Read the full article here


