Investment Thesis
The S&P Small-Cap 600 ETF (NYSEARCA:VIOO) is a simple solution for investors seeking broad market-cap-weighted exposure to U.S. small-cap stocks. Competing directly with IJR and SPSM, VIOO’s 0.10% expense ratio is the highest, but the differences are slight, and either of these three is worth considering. Today, I will evaluate VIOO against the Vanguard Small-Cap ETF (VB), a higher-quality fund more appropriate for growth investors than value. I will also introduce you to the iShares U.S. Small-Cap Equity Factor ETF (SMLF), a slightly more expensive option that seems like a nice compromise. I look forward to taking you through the statistics I have compiled, and I hope you enjoy the read.
VIOO Overview
Strategy Discussion
VIOO tracks the S&P Small-Cap 600 Index, a division of the S&P Composite 1500 Index that includes 600 U.S. companies based on market capitalizations. The Index employs an earnings screen for all members, a feature absent in the Russell 2000 Index and one that researchers at S&P Dow Jones Indices attribute to its superior long-term performance. This article notes how the S&P Small-Cap 600 Index outperformed in 17 of 25 years between 1994 and 2019. Since the Index also beat in 2021 and 2022 and lagged in 2020 and 2023, the Index’s batting average is an impressive 66% (19/29 years).
The takeaway is that VIOO, IJR, and SPSM shareholders are on the right track. Quality matters, and the S&P Small-600 Index does that much better than the Russell 2000 Index, with weighted average net margins 2.32% higher (9.18% vs. 6.86%) and free cash flow margins 2.95% better (7.44% vs. 4.49%).
Performance Analysis
The following table summarizes periodic total returns for selected small-cap blend ETFs with at least seven years of history. These returns are as of April 30, 2024, and show that VIOO ranks highly with a 124.36% total 10-year return, with VB and IJR slightly ahead. SPSM’s lower 116.28% return reflects how the ETF previously tracked the SSGA Small Cap Index and the Russell 2000 Index, but you’ll notice its more recent returns were slightly better than IJR and VIOO, reflecting its lower expense ratio.
The Sunday Investor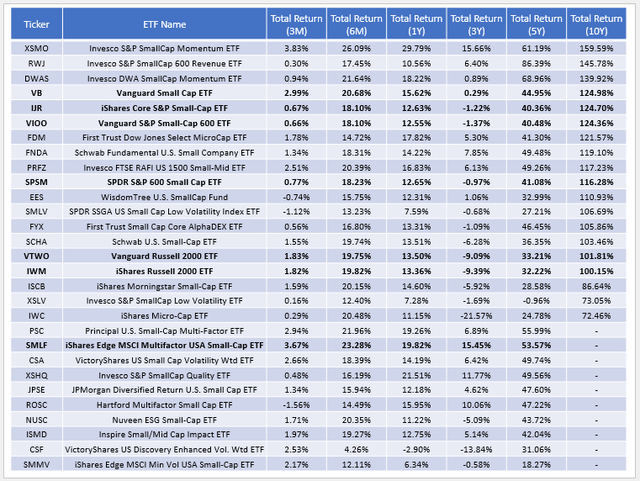
Over the last five years, VIOO’s 40.48% total returns rank #24/36, so it has had some difficulty in recent years. Of the 23 that outperformed VIOO, 17 are listed in the table above, meaning six others are relatively new. They include:
- Fidelity Small-Mid Factor ETF (FSMD): 53.46%
- iShares ESG MSCI USA Small-Cap ETF (ESML): 46.17%
- iShares Russell 2500 ETF (SMMD): 44.81%
- Goldman Sachs ActiveBeta U.S. Small Cap Equity ETF (GSSC): 43.09%
- Franklin LibertyQ U.S. Small Cap Equity ETF (FLQS): 42.58%
- John Hancock Multifactor Small Cap ETF (JHSC): 42.10%
At a minimum, investors appear to have many choices. As I mentioned earlier, I chose SMLF as a comparator, but if you’re interested in any of these alternatives, I hope you’ll reach out in the comments section afterward.
VIOO Analysis
Sector Exposures and Top 10 Holdings
The following table highlights VIOO’s sector exposures alongside VB and SMLF. Allocations are similar for the most part. However, VB has more allocated to Industrials, while VIOO overweights Financials.
Morningstar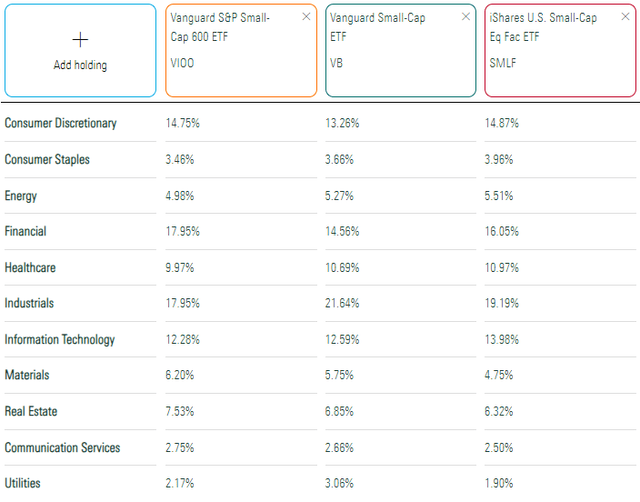
What’s not evident is how VIOO assigns a much lower weight to “larger” small-cap stocks, evidenced by its weighted average $3.06 billion market cap figure. VB and SMLF have $8.52 billion and $7.07 billion, so you might run into some overlap issues if you already hold ETFs in the mid-cap space. To illustrate, VIOO has 0% with the Vanguard S&P Mid-Cap 400 ETF (IVOO), but VB and SMLF overlap by 45% and 40%, respectively. Given the significant composition differences in the small-cap ETF space, assessing how well an ETF fits in your portfolio is critical.
VIOO’s top 10 holdings as of April 30, 2024 are listed below. They include ATI (ATI), Ensign Group (ENSG), and SPS Commerce (SPSC), and total 5.54% of the portfolio.
Vanguard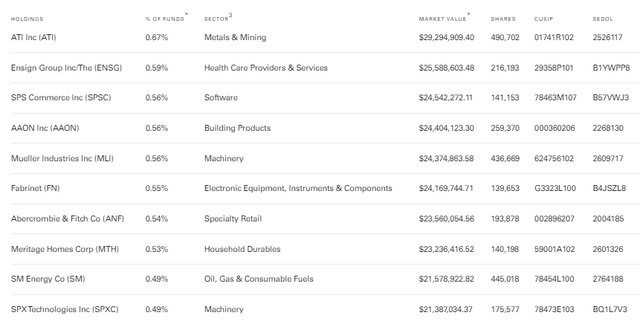
The weightings changed slightly in May, with Fabrinet (FN) now the top holding at 0.75%. The stock is up 43.71% in the last month after reporting record sales and earnings, and Stephen Cress, Seeking Alpha’s Head of Quant Strategies, also highlighted it last week. Still, the small-cap market is still reasonably well-distributed, with no single stock controlling the fund. This distribution contrasts with large-caps, where Magnificent Seven stocks comprise more than 25% of many ETFs.
VIOO Fundamentals By Sub-Industry
Since analyzing VIOO’s top holdings will provide little value, I’ve compiled a table of selected fundamental metrics for its top 25 sub-industries instead. This analysis covers 53.68% of the fund, and VIOO has some exposure to 122/160 GICS sub-industries, making it one of the best-diversified small-cap funds on the market.
The Sunday Investor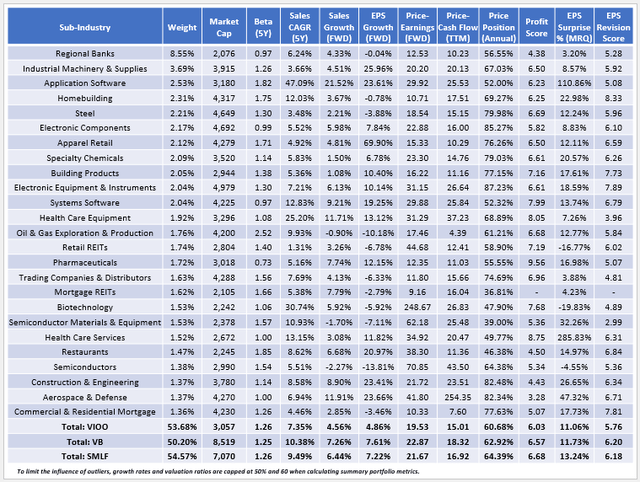
Here are three observations to consider:
1. VIOO is well-diversified, but so are VB and SMLF, with 50.20% and 54.57% allocated to their top 25 sub-industries. For those curious, the Invesco S&P SmallCap Momentum ETF (XSMO), the top performer over the last 10 years, is one of the worst diversified ETFs in the category. Therefore, I’m careful to avoid equating better diversification with better returns. Instead, I view it as a tool for managing risk. The more diversified an ETF is, the more likely it will deliver returns close to average in any given year.
2. Volatility is one feature small-cap investors must accept. VIOO’s five-year beta is 1.26, and the category average is 1.19. There are some exceptions, like the iShares MSCI Min Vol USA Small-Cap ETF (SMMV), but for the most part, volatility and size are inversely correlated. VIOO’s annualized standard deviation since its inception is 19.10% compared to 17.38% and 14.39% for IVOO and the Vanguard S&P 500 ETF (VOO).
Portfolio Visualizer
3. VIOO trades at 19.53x forward earnings using the simple weighted average method and 15.38x using the harmonic weighted average method, which you’ll find on sites like Morningstar. Either way, it trades at a discount compared to VB and SMLF, which makes sense because it offers less estimated sales and earnings per share growth. Looking at the table, Regional Banks comprise 8.55% of the portfolio, close to the 8.26% median for the category. SMLF is less at 6.88%, and as you might imagine, this lower exposure contributes to its higher growth profile. Earnings growth expectations are effectively flat for the next year, so I think limiting exposure to this sub-industry is a good idea despite its attractive value features.
VIOO Rankings: Small-Cap Blend Category
To help put things in perspective, I’ve compiled rankings for VIOO, VB, and SMLF on 10 factors that drive an ETF’s success. As shown, VIOO ranks reasonably well on metrics like assets under management and fees. However, there are some fundamental trade-offs I want to highlight.
The Sunday Investor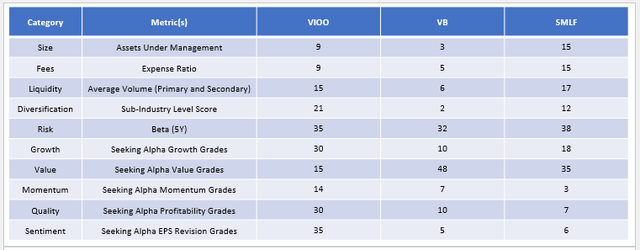
1. The rankings compare against 50 ETFs in the small-cap category. As you can see, VIOO ranks average on risk, growth, quality, and sentiment and above average on value and momentum. This “all-weather” approach could be why VIOO has been a consistent performer. To illustrate, here are VIOO’s annual returns from 2014-2023.
- 2014: 5.40% (#10/19)
- 2015: -2.15% (#6/20)
- 2016: 26.77% (#7/23)
- 2017: 13.17% (#15/27)
- 2018: -8.63% (#10/34)
- 2019: 22.67% (#23/35)
- 2020: 11.47% (#22/37)
- 2021: 26.74% (#17/42)
- 2022: -16.27% (#26/46)
- 2023: 16.18% (#34/48)
Notice how VIOO did not rank in the bottom quartile in any year. This wasn’t the case for VB, which ranked #20/23 in 2016 and #36/42 in 2021, nor SMLF, which ranked #28/35 in 2019 and #29/37 in 2020.
2. While I view VIOO’s consistent performance as a positive feature, its inferior rankings on growth and quality are likely reasons why it’s lagged in recent years. SMLF’s multi-factor approach better emphasizes the quality factor as does VB’s, since it includes more stocks with higher market caps. As a reminder, I recommend considering fund overlap, but VB and SMLF should work better in a “flight to quality” market.
Investment Recommendation
VIOO is a solid small-cap ETF with a reasonable 0.10% expense ratio, good diversification, and average or better rankings on key fundamental metrics like risk, growth, value, momentum, quality, and sentiment. Due to this all-weather approach, VIOO has avoided bottom-quartile performance in the small-cap blend category over the last decade, indicating it’s a relatively safe long-term play. IJR and SPSM track the same S&P SmallCap 600 Index, and since they have lower fees, I prefer them over VIOO.
Still, investors might find VB or SMLF more appropriate if they want more exposure to the growth and quality factors while maintaining sufficient diversification. I believe these are as good, if not better, solutions, and as such, I’ve assigned a neutral “hold” rating to VIOO. Thank you for reading, and I hope to answer any questions you might have in the comments below.
Read the full article here


