Introduction
In the search for the perfect ETF, one that is focused on future growth but with diversification from tech, I came across the iShares Russell Top 200 Growth ETF (NYSEARCA:IWY) that while not perfect has delivered stronger returns than the S&P 500 (SPX) despite more concentration than I would prefer.
Performance
The IWY has a good track record, beating the SPX since inception by almost 2x but concentrated in the 2019 to present time frame, as seen in the second chart below. The ETF has lagged behind the Nasdaq (NDX), which is to be expected given its broader growth focus.
Created by author with data from Capital IQ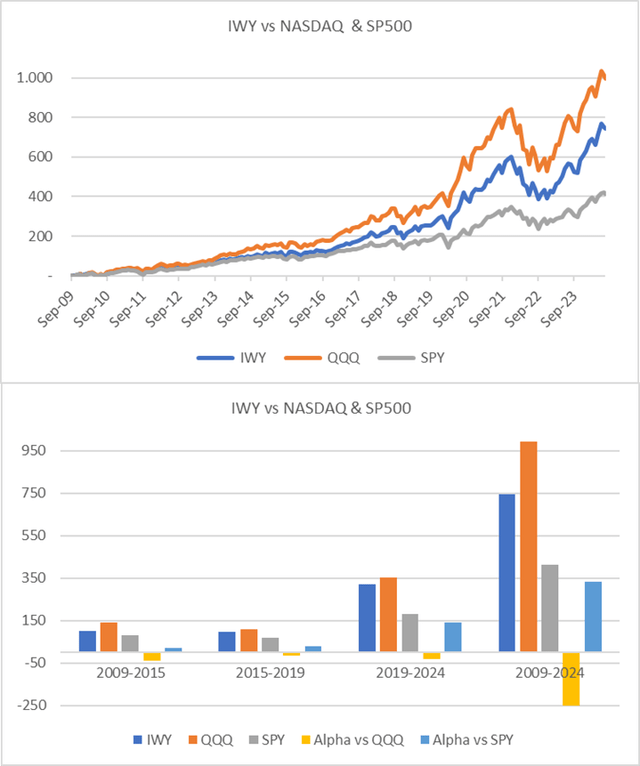
Portfolio Methodology & Concentration
The IWY replicates the Russell Top 200 Growth index, owned by LSEG (London Stock Exchange Group). Russell produces 100s of indices for the US market, with the Russell 2000 being the most “famous” and used as a small-cap barometer. The 200 Growth methodology selects the large-cap stocks from the Russell 200 with higher price/book, consensus 2-year forecasted EPS, and last 5-year revenue growth. Thus, the index incorporates forward-looking earnings growth vs the NDX or SPX that is selected by market cap size.
The image/table below summarizes the difference between the Russell Top 200 and the 200 Growth Index. The growth index is more concentrated with 106 names and has a higher valuation (PE and P/BV) and EPS growth.
The current portfolio/index has 106 stocks, with the top 5 making up 53% of AUM, which are all the usual tech suspects. The top 24 names make up 82% of AUM and 70% are tech stocks, the IWY seems to be morphing into a concentrated tech ETF.
LSEG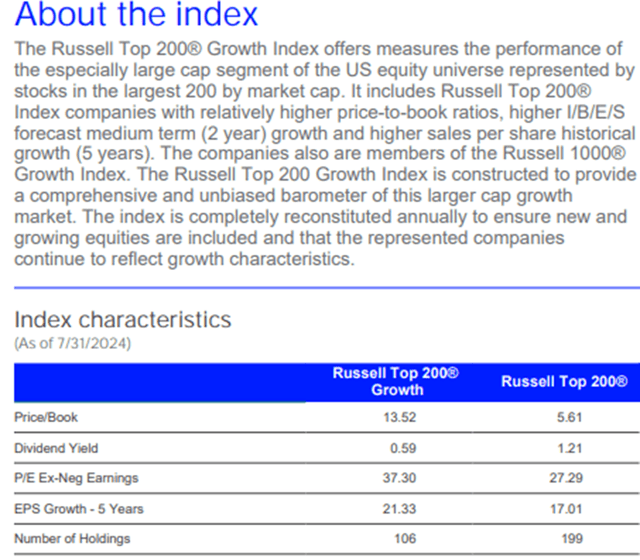
Portfolio Upside
I gathered consensus price targets for these top 24 stocks (82% of AUM) and calculated a weighted upside potential of 13% over the next 12 months (most analysts use 12-month price targets). As can be seen, the market is quite positive in the tech sector, with most projected to have over 20% upside potential. The main drag comes from Apple (AAPL) with a 6% potential upside, followed by Meta (META).
Consensus Price Target (Created by author with data from Capital IQ)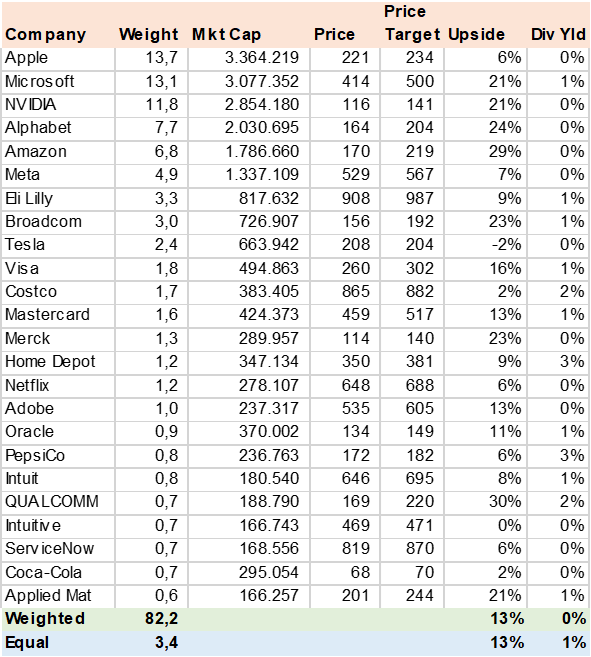
Revenue Growth
Part of the index methodology is to select stocks with high revenue growth in the last 5 years. The consensus revenue forecast for 2024 is quite high at 21% but then declines to 13% in 2025, nearly twice the SPX and in line with the NDX. This further suggests that the ETF is closer in construction to a Nasdaq fund. Apple’s low revenue growth rates and several consumer-oriented companies such as Costco (COST) and The Coco-Cola Company (KO) may result in their replacement or weight reduction over time. However, this index is limited to drawing its constituents from the Russell Top 200.
Consensus Estimates (Created by author with data from Capital IQ)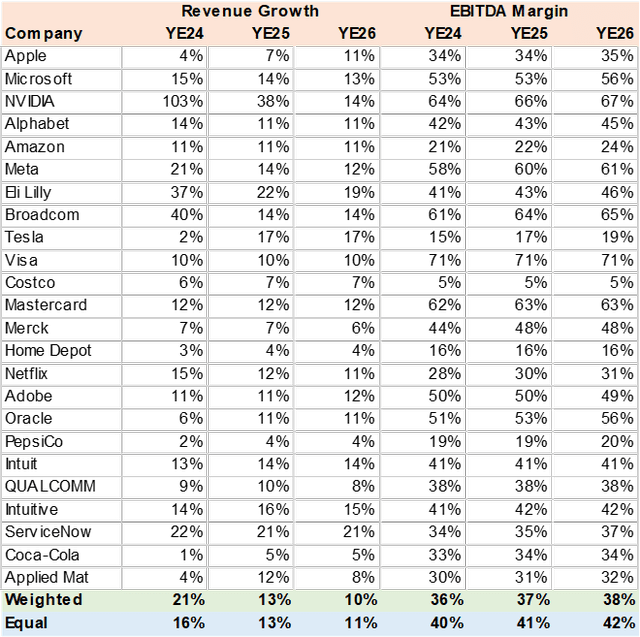
EPS Growth & Valuation
Using the same consensus data, I calculated the portfolio’s EPS growth at 34% in 2024 driven by Nvidia (NVDA) and Eli Lilly (LLY) which then moderates to 16% in 2025. This backs into a YE25 PE of 24x and a PEG ratio of 1.6x using the EPS growth rate estimated for the YE25-26 period. Both metrics (EPS growth and PEG) fall between the NDX and SPX and suggest that on earnings growth and valuation, the ETF may continue to perform in line with its track record.
Consensus Estimates (Created by author with data from Capital IQ)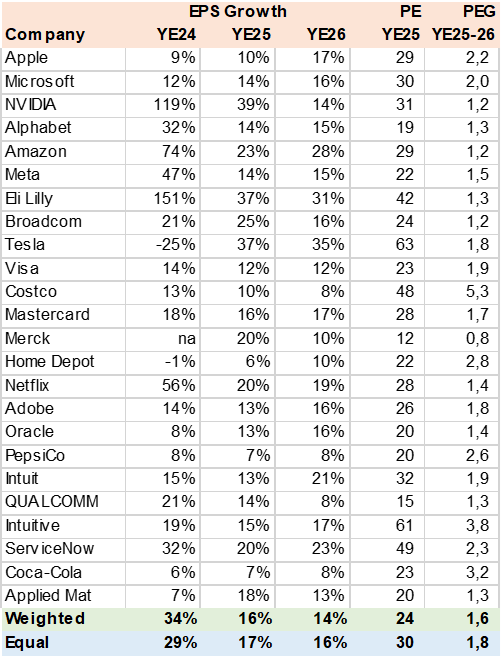
Risk
The main risk is if the consensus estimates used to select the portfolio are incorrect, then the index and ETF could be more exposed to multiple compression and underperform the SPX.
Conclusion
I rate the IWY a Buy. Despite the portfolio concentration in tech, the forward-earning growth stock selection criteria utilized by the index should keep this ETF away from stagnating large caps and provide investors with a relatively simple tool to invest in growth across all sectors. The track record suggests that the index methodology works and can deliver alpha vs the SPX.
Read the full article here


