Introduction
The iShares MSCI Saudi Arabia ETF (NYSEARCA:KSA) is a $600m sized product that covers 125 stocks from the Saudi Arabian market, which has traditionally been closed to foreign investors. In fact, KSA’s tracking index – the MSCI Saudi Arabia IMI 25/50 Index – still incorporates certain foreign ownership limits. Nonetheless, 2024 hasn’t been the greatest of years for this product which focuses on equities from the Middle East’s largest economy; on a YTD basis, when global equities have notched up gains closer to the early teens, our focus ETF has drifted lower by a little over a percent.
YCharts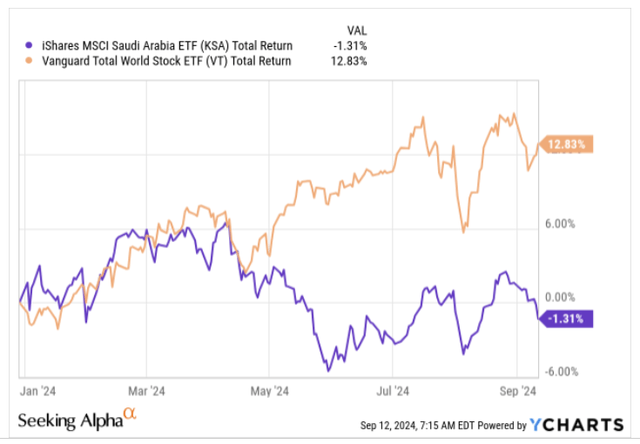
If you’re contemplating a position in this underperformer, here are a few things to note.
KSA Shouldn’t Be The Preferred Way To Play Saudi Equities
Note that KSA isn’t the only ETF vehicle to provide focussed access to Saudi equities in fact, the alternative- the Franklin FTSE Saudi Arabia ETF (FLSA) is significantly more cost competitive, with an expense ratio of 0.39%, which is only around half as much as the corresponding ratio of our focus ETF. Yet, investors who are looking for a wider pool of Saudi stocks may prefer KSA, as FLSA only focuses on half the number of holdings that KSA does.
Yet, it’s worth considering that the pursuit of a wider pool of names hasn’t really done wonders for KSA’s return profile; since FLSA was incorporated (in Oct 2018, 3 years after KSA) it has consistently outperformed KSA with the current differential working out to around 1300bps!
YCharts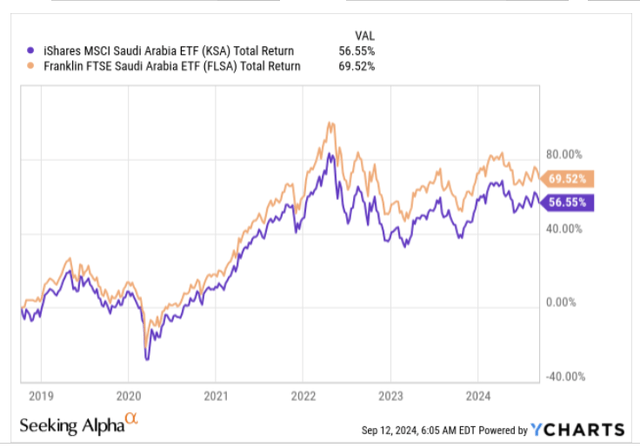
Total returns don’t necessarily provide a comprehensive picture of FLSA’s relative superiority.
As can be seen from the table below, FLSA appears to take on a much lower threshold of risk (lower standard deviation), regardless of the time frame in question, and also offers better hedging potential (lower betas). Meanwhile, it has delivered much superior alpha and also seen higher excess returns (over the risk-free rate) for every unit of total risk taken, as captured by the respective Sharpe ratios.
Morningstar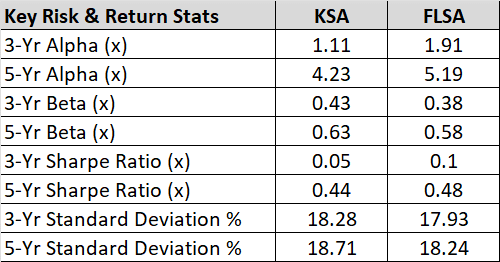
Over time, both products have offered identical average yields of a little over 2%, but since this year, the differential appears to be widening with FLSA currently offering a figure of 3.36%, which is over 50bps better than KSA.
YCharts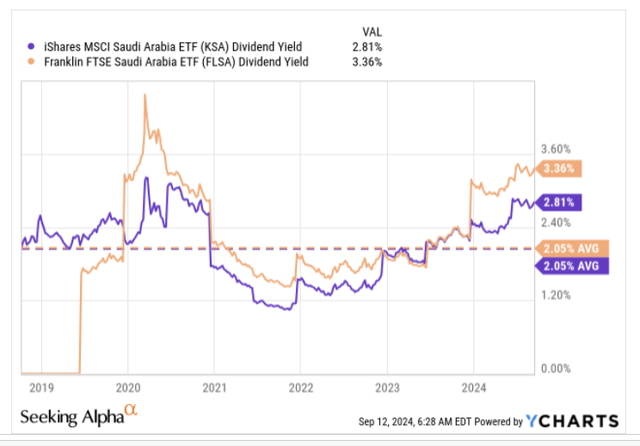
Overall, it’s pretty evident that KSA lags FLSA on a lot of counts.
Macro Considerations
Saudi has long-term ambitions to diversify away from oil, but as things stand, the conditions in the oil market still tend to largely drive sentiment towards Saudi Assets as it is the largest producer in the world. Oil prices are currently at 3-year lows, and weakness has been driven in large part by OPEC+ recent monthly report which saw oil demand for 2024 being curtailed to 2.03m bpd (barrels per day) 4% lower than what was forecasted last month. What’s key is that last month’s 2.11m bpd had been maintained since July 2023, so the recent revision has come after considerable deliberation.
Worryingly, OPEC+ also brought down global demand forecasts for next year as well, from previous estimates of 1.78mbpd to 1.74 mbpd. Prices could face further pressure, as 8 members from OPEC+ are poised to boost output by 180,000 barrels per day from October onwards. Earlier in the month, there were already reports suggesting that Saudi oil export prices to key markets such as Asia would take a 50-70 cent a barrel hit.
IMF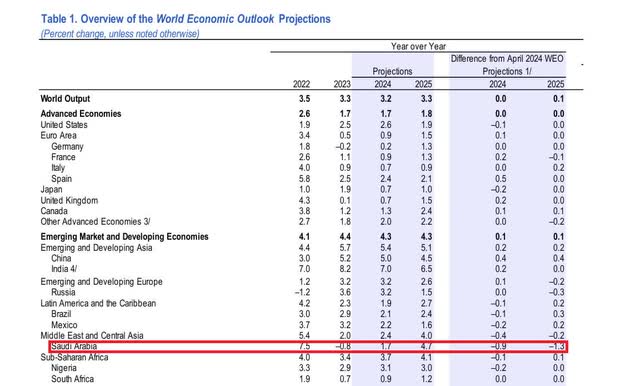
For further perspective, do note that a couple of months back, the IMF had already scaled down Saudi’s GDP growth expectations for both FY24 and FY24 by 90bps and 130bps respectively, and we suspect there could be further downside risks to those numbers when the October report comes out.
One is inclined to believe that KSA as a whole may not be as keenly affected as a pure energy portfolio, given that it is dominated by Saudi banks that account for 38% of the total portfolio. However, investors should also note that Saudi banking sector liquidity is increasingly becoming very scarce, and will likely put pressure on the funding base of these banks. Government-related entities (GRE) deposits have taken on a much higher mantle in the overall funding mix (currently at record highs of 32% of total deposits), but these are all largely high-cost term deposits that are replacing the low-cost CASA deposits.
Closing Thoughts – Valuation and Technical Considerations
A potential long position in KSA is further dampened by what the charts and the valuations are suggesting.
KSA remains one of the more pricier emerging markets on offer today, with a P/E ratio of over 18x, which translates to almost a 40% premium over a popular basket of diversified EM stocks. What’s even more troubling is that EMs in general are expected to facilitate long-term earnings growth of 13.5%, but KSA’s portfolio of stocks is only poised to deliver long-term earnings growth of 8%.
YCharts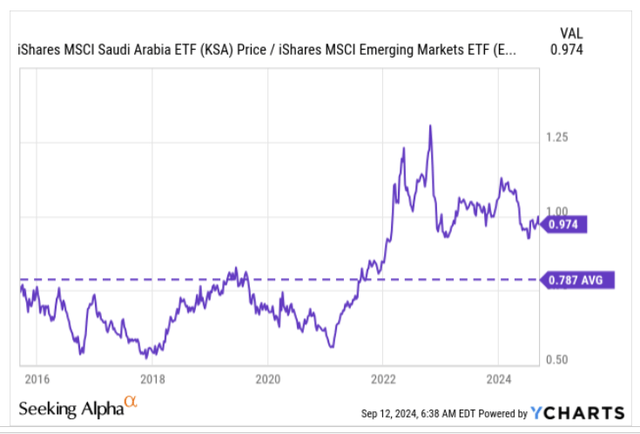
The image above further suggests why rotational specialists who are looking to enter oversold counters within emerging markets are unlikely to take a fancy to Saudi equities. On the contrary, KSA’s relative strength ratio versus other EMs which has typically averaged around 0.79x, currently trades at a 24% premium and runs the risk of mean-reverting.
Finally, moving over to KSA’s own weekly imprints, we can see that the price has been following something similar to a descending triangle pattern which shows that demand is weakening over time, and previously flattish support levels could give way. While this does not necessarily have to transpire, and if you’re still only looking to trade the two boundaries, it’s questionable if a long position now would be the best use of resources, given that the price is only around 6% away from the upper boundary of the triangle, and around 11% away from the lower boundary of the triangle; until the risk-reward turns more favorable, we don’t see the merit of going long here.
Investing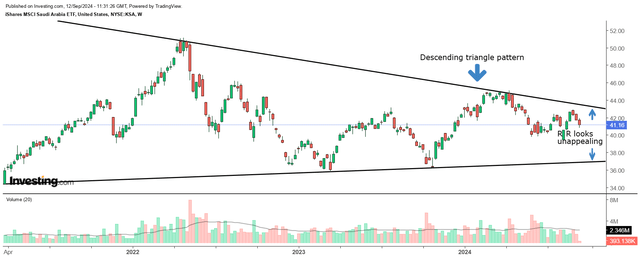
Read the full article here

