Photronics, Inc. (NASDAQ:PLAB) is a global player operating in the semiconductor and LCD screen market. It enjoys good financial ratings, in particular Revenue and EBIT has grown by double digits since 2022 and this has also allowed the share price to reach its 10-year historical high in 2023. The high level of margins was achieved thanks to strong demand but also above all to an increase in market prices. Precisely this element, which may not be directly controllable by the company, currently represents the main growth driver and could represent the greatest risk for company profitability in the future. The share price appears to be at high levels while the comparison with the main competitors indicates that there may be more convenient companies at this time. My rate is Hold.
General Overview
Photomasks are key components in the manufacturing industry of semiconductors, advanced LCD screens, and other electronic devices. They are planes of transparent glass or quartz on which models of integrated circuits or other electronic devices are engraved or projected. Photomasks serve as stencils for the production of integrated circuits and are used in the photolithography process.
Photomasks require extreme precision and high resolution to ensure accurate reproduction of circuit details. An error in photomasks could adversely affect the performance and functionality of semiconductors. The semiconductor industry requires customized and often complex photomasks to produce increasingly advanced and powerful devices. Photomasks are therefore essential for the production of high-quality microchips, semiconductor devices, and LCD screens.
Photronics, Inc. is a US company specializing in the manufacture of photomasks used in the manufacturing process of semiconductors, semiconductor devices, and advanced LCD screens. Founded in 1969 and headquartered in Brookfield, Connecticut, Photronics plays an integral role in the semiconductor industry’s supply chain. The company operates worldwide, with manufacturing and technical support facilities in multiple regions, including the United States, Europe, and Asia. The non-US revenue is 85% and this global presence allows the company to serve customers around the world and adapt to different regional needs.
Photronics supplies photomasks to a wide range of customers, including semiconductor manufacturers, technology companies, device manufacturers, and other companies that require high-precision components for their products.
Market Overview
“Moore’s Law”, formulated by Gordon Moore, co-founder of Intel, predicts the doubling of the number of transistors on a chip every 18-24 months. This law has driven the evolution of the semiconductor industry for decades and now we can state that the global semiconductor market is extremely large. In 2022, according to Gartner, the industry set $599.6 billion in annual revenue; for 2024, the forecast is $630.9 billion with 2023 in a downtrend ($532.2B).
The demand for integrated circuits is constantly growing thanks to the expansion of consumer electronics, the adoption of advanced technologies such as the Internet of Things [IoT] and artificial intelligence [AI], as well as industrial and automotive automation. These industries require increasingly advanced semiconductors. The industry is characterized by rapid technological progress. Miniaturization, reduction of manufacturing processes, use of advanced materials, and custom design are driving innovation. Products manufacturing requires highly sophisticated and expensive facilities. The challenge of maintaining the pace of technological innovation and growing demand is constant.
The photomask market (directly connected to the IC market) according to Data Bridge Market Research was $ 4.52 billion in 2021 and is expected to reach $ 5.91 billion by 2029 (CAGR of 3.40 %). If we look at the results of Photronics we can think that this growth estimate may be quite conservative.
Data Bridge Market Research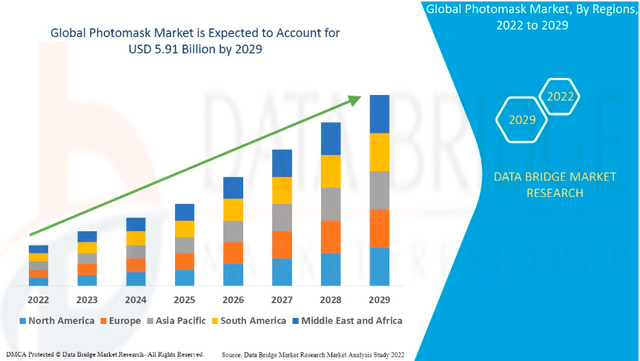
Financial and Highlights
Revenue and profitability
Seeking Alpha + Author Graph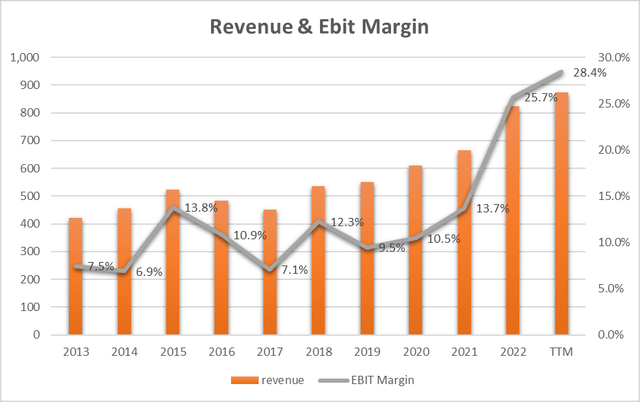
Revenue in 2023 reaches the peak of the last 10 years at $874.9M [TTM] with an annual growth rate of 7.6% [CAGR]. However, the greatest growth of the last decade concerns 2022 where in just one year the revenue increased by 24.2%.
The reasons for this explosion can be found in the company’s 10-K form:
IC revenue increased by 28.9%, due to strong demand for both high-end and mainstream photomasks and improved pricing for mainstream products and products at the most advanced node levels. FPD revenue increased by 13.7%, driven by a 20.1% increase in revenue from high-end products, which was driven by increased demand and better pricing for AMOLED products used in mobile displays and increased demand for G10.5+ large area masks used for ultra-large televisions.
The most interesting thing concerns precisely the growth in sales prices which has a greater impact on the IC sector but which also has a notable impact on screens. 2022 and 2023 grew mainly due to a sales price factor and this is an exogenous element that is characterizing the global market.
Moving on to analyze the EBIT we note, also in this case, that the values of 2022 (25.7%) and 2023 (28.4%) outperform the trend of the previous 8 years whose range had reached the maximum peak of 13.8%. We are talking about almost 15 percentage points of additional margin achieved in just two years!!!
Analyzing the reasons for this explosion in this case too, we note that this occurred almost entirely at the gross margin level. We therefore understand that the increase in raw material costs was not such as to cause such a high increase in sales prices, which therefore largely determined the margin gap.
The above analysis allows us to understand the sustainability of growth on the one hand and above all the sustainability of these levels of marginality.
Return on Capital Employed
Seeking Alpha + Author Graph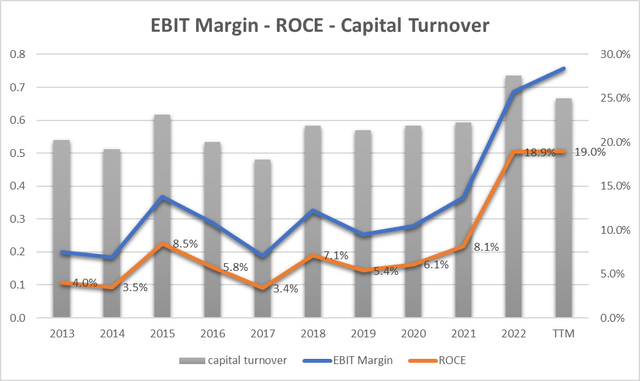
ROCE analysis allows us to understand how much profitability can be attributed to the virtuous use of the capital employed in the company. From the graph, we can immediately notice that the capital turnover (how much $1 is used in the company in terms of sales) is always less than 1 and this implies a less-than-optimal use of capital. I would like to see this parameter always greater than 1.
2023 also sees a decrease in capital turnover and this is mainly due to a substantial increase in assets employed which did not ‘result’ in an equal increase in revenue. Analyzing the balance sheet data we note that Cash and liquidity increased by approximately $120M against an increase in revenue of $50M. The company in 2023 created cash without investing it in sales and profits.
EPS, Free Cash Flow, and Capex
Seeking Alpha + Author Graph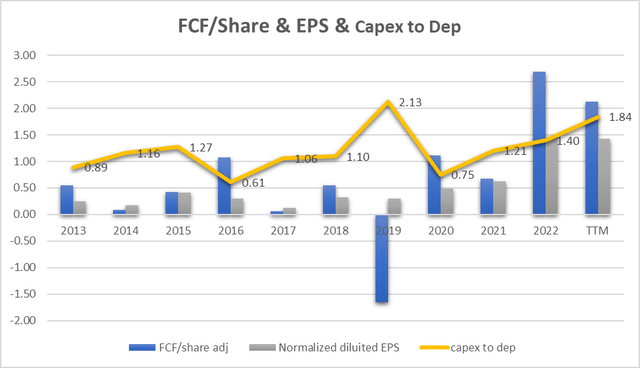
EPS (grey bars) follows the trend of the EBIT margin. Slightly increasing trend with a marked peak in 2022 and 2023. The same considerations made in the previous paragraph therefore apply.
The FCF per share (blue bars) on the other hand sees a more irregular trend. 2019 also recorded a negative figure and this is due to a negative impact on the inventory of $23.1M. Since the inventory data was kept under control in all other years, we can hypothesize that this event was isolated. For the rest, also, in this case, we have recorded a mainly growing figure in the last two years and this is mainly due to the result of operational activities.
The last data we analyze is the trend of Capex compared to depreciation (yellow line). Generally, this parameter should be around unity and we can see that the graph attests to the virtuous behavior of the company. In particular, here too we record an increase in 2022 and 2023 and this identifies an increase in investments in productive assets probably to meet the growing market demand.
Competitive advantages and future scenarios
In the future, the production of AMOLED panels on G8.6-sized glass could continue in a positive trend. This product requires a new level of high-quality photomasks, favoring the leadership of Photronics technology. This places the company in a position of competitive advantage relative to the technology used. The growing demand for AMOLED should also allow for better use of the company’s production capacity and therefore allow for an optimization of operating costs.
The recovery of the semiconductor industry appears to be slower than expected due to continued macroeconomic uncertainty and subdued consumer demand. On the positive side, however, the trend in the intensive field of IC design should be a positive driver for Photomask. Applications in artificial intelligence, data centers, the Internet of Things, automotive, industrial, and machine learning continue to push chip manufacturers to release many new types of IC designs. Since each model requires a unique set of photomasks to trigger this IC product, it increases demand.
PLAB and Earnings Power Value
Assuming that the cash profit remains constant over the long term, I use the EPV (earnings power value) method to calculate the intrinsic share price value.
The method starts with EBIT. The second step is to add depreciation and amortization and then subtract stay-in-business CAPEX.
The result is the Cash Trading Profit
I then subtract the taxes by calculating the amount using the actual tax rate that the company pays.
The result is the After-Tax Cash Trading Profit
At least to calculate the total company enterprise value I divide the After-Tax Cash Profit by the interest Rate I define as fine for this kind of Company (according to a study made by NYU, the cost of capital for semiconductor equipment is 13.24%)
The result is the Total Company Earnings Power Value. Dividing the result by the total number of shares we find the value per single share.
The table below shows the calculation for PLAB
|
EBIT |
248.80 |
|
Dep & amort |
78.60 |
|
CAPEX |
-144.80 |
|
Cash Trading Profit |
182.60 |
|
TAX |
25.60% |
|
TAX |
-46.7456 |
|
After TAX cash profit |
135.85 |
|
Interest Rate |
13% |
|
EPV |
1026.091 |
|
Share in issue |
61.30 |
|
EPV per share |
16.7 |
$16.7 represents the share price valuation using the EPV method. If we compare the data with the current market price ($20.4) we see that the current price could be seen as a little bit expensive.
Peer Comparison
In the photomask industry for semiconductor and advanced display manufacturing, Photronics, Inc. faces competition from several companies. In the same photomask sector, Photronics’ main competitor is:
Applied Materials, Inc. (AMAT): is one of the world’s largest semiconductor manufacturing equipment and materials companies. It offers turnkey manufacturing solutions, including lithography equipment, that compete directly with Photronics.
In the same reference industry (Semiconductor Materials and equipment) but not direct competitors (as they do not produce photomasks) I have identified the following peers with a market capitalization similar to the PLAB Industry:
- Veeco Instruments Inc. (VECO)
- Ultra Clean Holdings, Inc. (UCTT)
- PDF Solutions, Inc. (PDFS)
- ACM Research, Inc (ACMR)
As we can see from Quant Ratings, the semiconductor materials sector is not enjoying a particularly favorable moment. All companies have a ‘Hold’ rating except for ACMR (‘Strong Buy’). In general, it would therefore appear that ACMR is preferable in terms of investment when compared to PLAB
Seeking Alpha
Going into the details of the evaluation we can see how in terms of PLAB Evaluation it is the most attractive (‘A’) while it becomes the least interesting if we talk about EPS Revisions (‘D-‘). In the other evaluation parameters (Growth, Profitability, and Momentum) PLAB achieved average comparison values.
Seeking Alpha
Ultimately, if we want to invest in the semiconductor materials market, the comparison probably decrees that ACMR could be the best solution.
Potential Risks
The semiconductor sector is globally going through a favorable period with growing demand and above all prices. Listening to the latest earnings call:
Our price protects our long-term cost agreement with a major customer and also the product mix, especially in IC areas. We have more high-end product mix compared to previous quarter. So the compound ASP actually is better, so this is on the ASP and revenue side. In terms of cost, our procurement team and operation team has worked together to reduce the usage of materials and to improve the operation efficiency to control the cost.
We can see how the company management also defines the price factor as a determining element in carrying out the business in the long term. In my opinion, this element, if referred to the global market, is not directly controllable by PLAB, and represents a risk factor in the coming quarters as it could reduce revenue growth and above all bring margins back to levels before 2022. It is clear that if this scenario comes true, the EPS will fall and the share price could also be induced into a bearish market phase.
Conclusion
Photronics, Inc. is going through an excellent moment from the point of view of revenue growth and above all the EBIT margin. It is growing much faster than the global semiconductor market. This element is mainly due to a company’s competitive advantage due to the high technology developed but also to exogenous factors such as the selling prices of the components. The positive trend seems likely to continue in the next quarters but the share price seems to have already reached high levels and above all there are, at this moment, possible alternatives for investing in the semiconductor materials market. My rate is Hold.
Read the full article here


