Investment summary
After a brief snapback rally from FY’22 into FY’23, Smith & Nephew plc (NYSE:SNN) has sold off sharply following its Q2 numbers. The market was unequivocal in its appraisal of the company, with the post-earnings drift now sending the stock beneath its 200DMA.
One of the major tension points is that SNN is a capital-hungry business, requiring tremendous reinvestment into working capital-versus fixed capital or M&A-to maintain its competitive position. Issue being, these investments are inefficient, taking a long time to recycle back to cash or grow profitability/FCF as a function of capital employed.
Back in May, I covered SNN with the following take-outs:
- Despite reasonable top-line growth and an emphasis on addressing core issues in the business, investors have overlooked SNN for more selective opportunities in 2023.
- At the time, there was a dislocation between company and investment performance, with the latter showing resolve despite mixed fundamentals.
- Economic characteristics that see SNN reinvesting capital into its operations at below-market rates of return.
This report will discuss the latest investment updates and focus in on the price-implied expectations of the company, given the fact that (i) it has sold off so sharply in H2 ’23, and (ii) the mixed economic factors that SNN presents looking out into the coming quarters.
The market’s view of SNN aligns with my own, and I see no evidence to deviate from the market’s pricing of the company based on its economic characteristics or propensity to overcome key challenges. Net-net, reiterate hold.
Figure 1. SNN 2-year price evolution, weekly bars. Now trading at 200DMA with sharp selloff into H2 FY’22
Data: Updata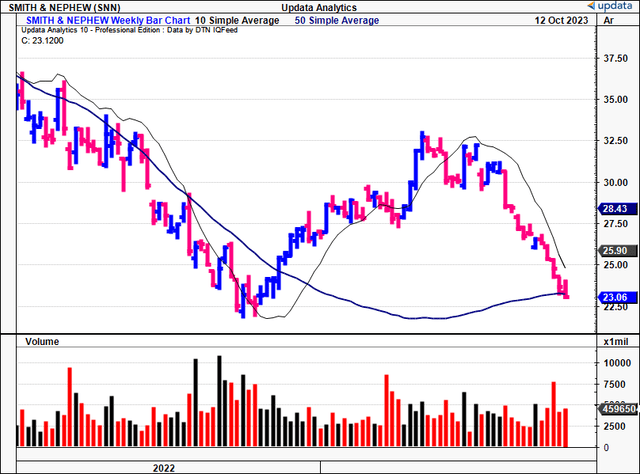
Broad market overview
Setting the context for SNN’s prospects moving forward, two critical themes emerge. One relates to the broad healthcare market, the second directly to hospital economics throughout FY’23.
Research from
McKinsey (2023) projects that “healthcare profit pools will grow at a 4% CAGR from $654Bn in 2021 to $790Bn in 2026”, revised down from previous estimates of 6% CAGR. Labor shortages and overall inflation rates continue to compress the growth outlook for the broad sector. In particular, its outlook on acute care and post-acute care (inc. surgeries) has “worsened” from original forecasts made in 2022. Critically, regarding share of the profit pool (and growth of the same) it projects specialty pharma, healthcare services and Medicare segments to gain the most share, at odds with SNN’s business prospects.
Figure 2.
Source: “What to expect in US healthcare in 2023 and beyond”, McKinsey (2023)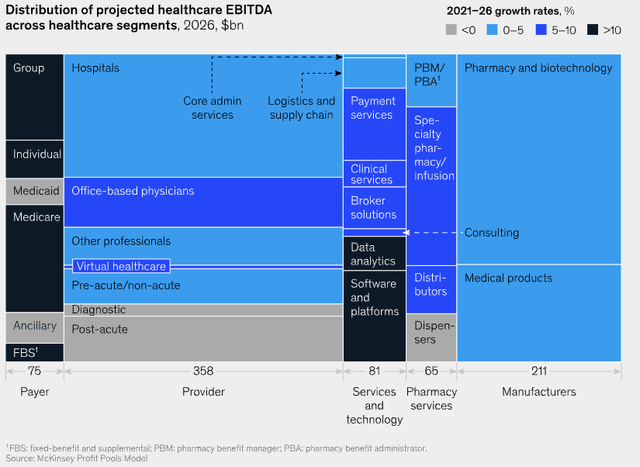
Similar findings are presented in Kaufman Hall’s August ’23 Hospital Flash Report, a key dataset for anyone tracking this sector, and one utilized regularly by this channel as my regular readers will know. The key findings from August are that patient turnover trends have more or less normalized to pre-pandemic range, but that margins are “still below historical levels”, despite lower variance. It opines that “[d]ecisions surrounding capital investment and capital capacity…should be informed by a rigorous process of examination that considers market opportunities, strategic priorities, risk, overall mission, and values“. To me this implies (i) tighter capital controls, and (ii) more selective capital allocation by hospitals moving forward.
Consideration of facts in reiterated hold thesis-what’s changed, what hasn’t
1. Executive turnover
Analysts on the Q2 earnings call were correct in identifying “[w]e’ve clearly seen a lot of management change at Smith & Nephew over the years“. CEO Deepak Nath announced a slew of further changes to SNN’s management team on the call, noting the desire to achieve more accountability and to remove inefficiencies, whilst simplifying operations.
The specific changes are outlined below, and include changes in orthopedics, sports med, advanced wound and R&D. No saying as to whether these changes contributed to the sharp selloff post earnings in Q2. But it does hammer in the fact there’s been a number of changes at SNN in recent times. Markets like stability in leadership-predictability even-so it remains to be seen what the new changes will bring in terms of economic value for shareholders going forward. In my view. this is a space to be watching very closely over the remaining periods of FY’23 to gauge early efficacy.
Source: BIG Insights, Company filings
2. Progress of “12-point plan”
In my February publication, I rhapsodized about SNN’s 12-point plan that it instilled leading into the new financial year, noting “it hopes to address productivity via a multi-pronged plan, looking at its cash conversion, procurement, and manufacturing efficiencies”.
Management says it is ~45% there when it comes to fulfilling its targets, as seen in Figure 3. Most of the gains, as it were, have been in scaling its orthopedics and wound care businesses, potentially capturing market share in doing so (although, there’s not quantifiable evidence to support this). It had aimed to release 25 products this year, and has hit the halfway mark on this as of H1 FY’23.
Moreover, H1 revenues were up ~5% YoY to $2.73Bn, with the bolus of growth underscored by its sports med and advanced wound segments (up 8.4% and 5.1%, respectively, FX included). It would appear the orthopedics business continues to languish, reporting just $31mm in additional sales from H1 FY’22. This aligns with findings from earlier, in the challenges faced by hospitals in acute and post-acute settings.
Figure 3.
Source: SNN Q2 FY’23 Investor Presentation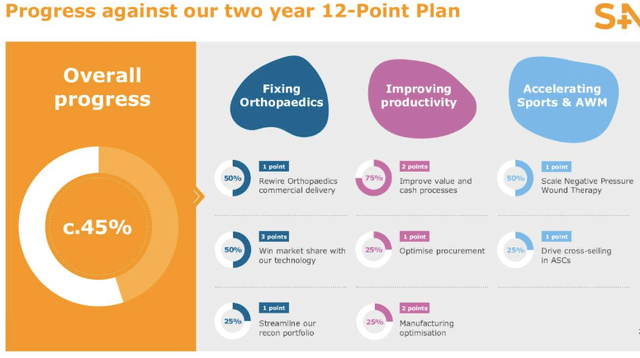
Figure 4.
Source: SNN Q2 FY’23 Investor Presentation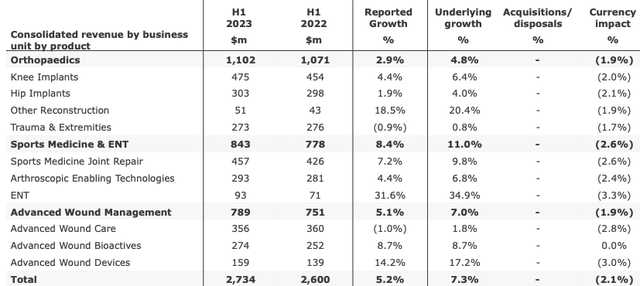
3. Cash conversion and inventory management
Operating cash flows were down to $110mm in H1 from $154mm last year, producing $1.18Bn in TTM FCF after all investments in CapEx, acquisitions and working capital. Specifically, its NWC requirements were up by $326mm as it continued to increase its inventories on hand.
Keep in mind this is a company with more than $2.4Bn of inventories on the books, itself intensive enough, but this has increased by 42% since 2020, whereas quarterly revenues have grown at just 8% over the same period.
In my view, this was a critical factor the market was looking for SNN to improve on this year. It has been a talking point for some time now, and the supply chain fiasco of last year doesn’t really cut it as an excuse by estimation. For one, overdue orders are still high, despite reducing by 50% from their peak, and the company is only 85% of its targeted line item fill rate.
Three factors are driving this:
(1). Component availability/supply constraints
(2). Adding of components/instrument sets as additional inventory on hand,
(3). Excess factory inventory to “protect our manufacturing against external supply disruption”.
Point number (3) is crucial to analyze further. Most of the supply chain headwinds have resolved across industry in ’23. Sales aren’t growing at near the pace of booked inventories, neither are cash flows. But more crucially, SNN’s cash conversion has blown out to a magnitude of unattractive proportions. Its cash conversion cycle is now 417 days as seen in Figure 5, on inventory turnover of 1.5x and DSO of 86 days. So each $1 invested into NWC is tied up in working capital for >1 year at this rate. Not attractive. In my opinion, this definitely feeds into the company’s sharp selloff.
BIG Insights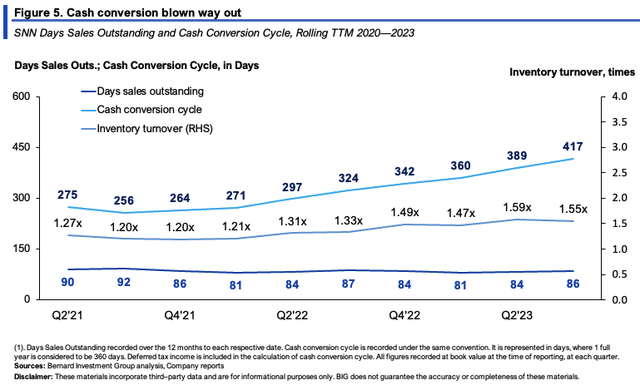
4. Price implied expectations
SNN sells at 13.9x forward earnings and 13.3x forward EBIT at a market cap of $10.14Bn and EV of $12.9Bn as I write. The market therefore expects $1.66/share in FY’23 earnings and ~$970mm in pre-tax income (12,900/13.3 = 969). The market expects an avg. 10.5% earnings growth rate out to FY’25 based on consensus forecasts, and I estimate this will continue out to FY’28. Afterwards, I’ve capitalized the company’s earnings at a 12% hurdle rate, reflecting long-term market values and our threshold margin of return on capital.
The market’s required rate of return for SNN is the discount rate needed to discount these forecasts back to its current market value of ~$23/share at the time of writing. It is 5.4% with a range of 2.4% to 14.7% based on various stipulations outlined in Figure 6.
This suggests:
(i). Low risk priced into the company’s current market value, likely reflecting predictability of its cash flows,
(ii). Investors expect sluggish bottom-line growth from the company into the coming periods, but
(iii). It expects SNN to outpace the profit pool estimates outlined by McKinsey earlier in this report.
BIG Insights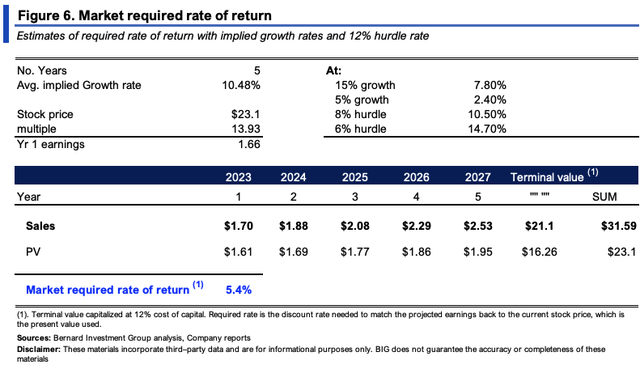
The question is, what evidence is there to expect a revision in these expectations? In my view, little-to-none.
Consider that:
- This is a capital-hungry company that requires substantial investment to NWC to maintain its competitive position, mainly inventory and receivables. For the last 3 years, each $1 in sales growth came with $1.11 in NWC investment. Problem is, NWC efficiency is low, and recycling each $1 in NWC back to cash takes >1 year.
- For its efforts, this is also a low-margin, low capital turnover business, with post-tax margins of ~14-17%, and capital turns of ~0.6-0.65x. This tells me it enjoys neither consumer nor production advantages, is unable to differentiate on product or price, and doesn’t sell below industry averages.
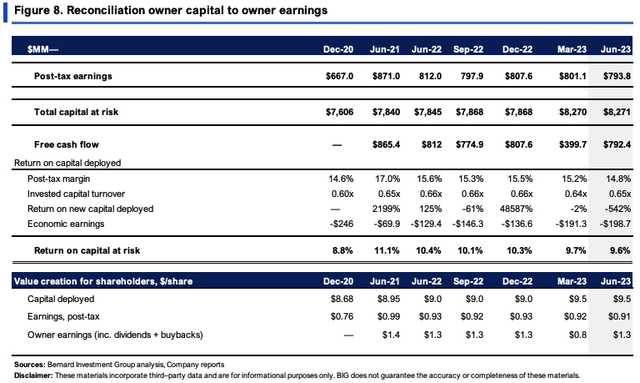
- It had $9.50/share of investment required to operate in Q2 FY’23, and produced $0.91/share in trailing NOPAT on this, 9.6% return on investment. This is within historical range, as seen below.
As a result, the company’s investments aren’t economically valuable, supporting the notions outlined thus far. In my estimation, these trends are poised to continue moving forward.
BIG Insights BIG Insights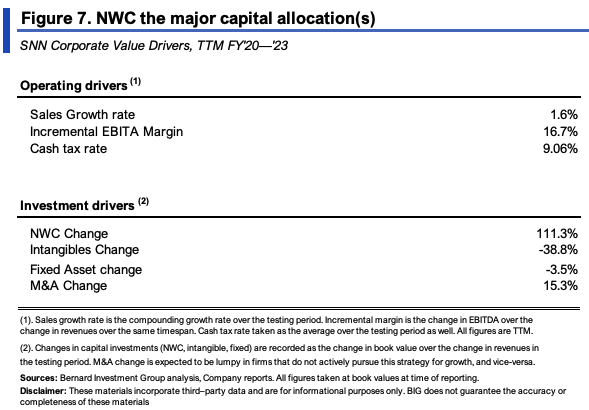
Valuation and conclusion
At the multiples described earlier, SNN is trading at a discount to peers, opening up the question of relative value. It’s important to consider if these discounts are warranted, or if there’s an opportunity to capture a change in expectations.
Thinking in sound economic principles is therefore critical, which includes the following:
- SNN management says it will work down the inventory buildup discussed earlier in this report. Will this increase the pace of cash conversion from NWC? Who knows. It was still 275 days back in 2020 when there were no supply issues. Growth in FCF is therefore hindered in my view.
- That said, looking at cash SNN can throw off to shareholders (FCF to owners), even with all dividends paid up and buybacks included, you’re still looking at just $1.30 in owner earnings, around 5.6% yield at the time of writing. This aligns with the market’s implied expectations. Going forward, it would need to produce ~$2-$2.50 to change these said expectations, otherwise 8-10% yield on owner earnings.
- Extending the value drivers in Figure 7 out to FY’24, I get to only $1.50/share in owner earnings, unsupportive of a deviation from market consensus.
Extending the calculus out to FY’28 then discounting at our 12% required rate of return arrives at an implied intrinsic value of $17-$18/share. Even in the blue-sky scenario-the absolute best outcome in this modelling, ahead of the upside case- that looks to ~6% growth on 20% margins, I get to $23/share. This corroborates a neutral view and supports the headwinds depicted in this analysis.
BIG Insights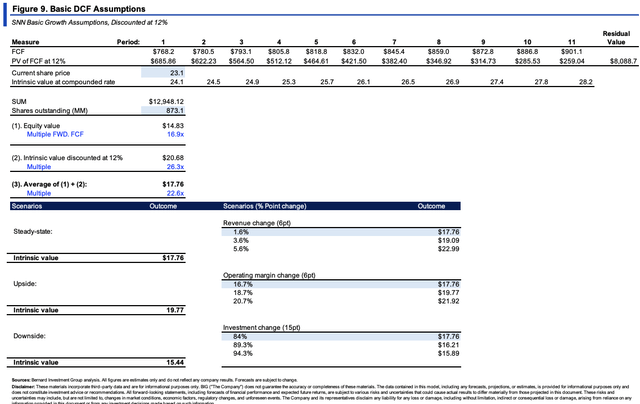
Discussion summary
The compressors of SNN’s market value are relatively clear on close inspection. Namely, this is a capital-hungry, low-margin/low capital turnover business that requires heavy investment into inventory and receivables to maintain its competitive position. It takes >1 year to recycle $1 investment into NWC back to cash, and it has recently taken steps to expand its inventories on hand even further. The market was not receptive to these capital budgeting initiatives after its Q2 numbers, sending SNN’s stock price to new lows. The economic characteristics SNN produces are equally unattractive in my opinion, with flat owner earnings and sub-par returns on capital deployed.
That being said, I continue to rate SNN a hold, advocating more selective opportunities elsewhere.
Read the full article here


