Continuing the series of articles on funds that offer exposure to certain equity echelons, today I would like to review the Schwab U.S. Mid-Cap ETF (NYSEARCA:SCHM), an index-based investment vehicle targeting mid-size U.S. stocks.
To begin with, what I found under the hood is a rather interesting growth story, mostly manifested in a double-digit weighted-average forward revenue growth rate, which comes with an EPS growth rate just a few bps lower. However, the principal issue is that, with inflation remaining a primary concern, the growth factor is not what I would favor. Instead, inexpensiveness and quality should be a combination to consider. And when it comes to these fronts, SCHM looks rather weak, as it is priced rather generously, with quality being far from perfect. In this regard, I see little reason why an investor should buy into this ETF at this juncture.
SCHM Strategy: Essential Points
The SCHM website says the fund’s strategy is based on the Dow Jones U.S. Mid-Cap Total Stock Market Index, which it has been tracking since its inception in January 2011. The following brief description of the index is provided in the prospectus:
The index includes the mid-cap portion of the Dow Jones U.S. Total Stock Market Index actually available to investors in the marketplace. The Dow Jones U.S. Mid-Cap Total Stock Market Index includes the components ranked 501-1,000 by full market capitalization. The index is a float-adjusted market capitalization weighted index.
As mentioned in the fact sheet available on the S&P Global website, the index is rebalanced quarterly (March, June, September, and December).
What Is Inside The Portfolio? A Few Notable Growth Stories, But Value Leaves A Lot To Be Desired
As of October 10, SCHM’s portfolio included 499 stocks and REITs. According to the dataset available on the fund’s website, there were other types of holdings as well, like cash and a money market fund. Most companies have had a US country code, even though about 5.1% were allocated to 27 names with a different one. A few examples worth mentioning are Autoliv plc (ALV), a Stockholm-based automotive safety systems manufacturer, with an SE code, and Perrigo Company plc (PRGO), a Dublin-based firm operating in the pharmaceuticals industry, with an IE code.
Holdings’ weights look comparatively evenly distributed, with the key ten stocks accounting for only 4.76% of the assets. Jabil (JBL) was its main position, with a 0.494% weight, followed by FactSet Research Systems (FDS) which accounted for 0.485%.
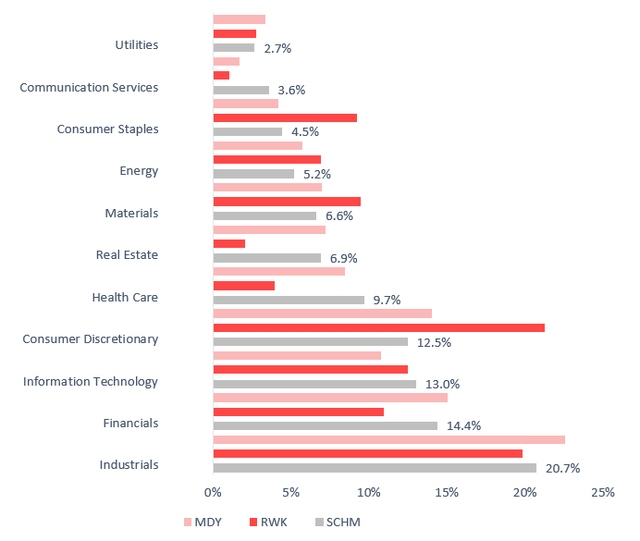
The chart below is supposed to present SCHM’s sector allocations in an appropriate context, compared to the SPDR® S&P MIDCAP 400® ETF Trust (MDY) and Invesco S&P MidCap 400 Revenue ETF (RWK). I covered both in the past, with the most recent analysis on RWK published in February this year. MDY was covered in October 2021.
Created using data from the funds
MDY and SCHM have mostly similar sector mixes, both heavy in industrials and financials, in contrast to smart-beta RWK, which is overweight in consumer discretionary.
Now, let us look closely at the main factors, namely size, value, quality, growth, and volatility. Below is the table compiling the relevant metrics worth reviewing.
| Metric | 11-Oct |
| Market Cap | $9.65 billion |
| EY | 4.42% |
| P/S | 5.38 |
| EPS Fwd | 9.97% |
| Revenue Fwd | 10.18% |
| ROA | 4.80% |
| ROE | 11.79% |
| Quant Valuation grade B- or higher | 22.4% |
| Quant Profitability grade B- or higher | 74.3% |
| 24-month beta | 1.08 |
Created using data from Seeking Alpha and the fund. Holdings as of October 10, financial data as of October 11
First, we clearly see that SCHM delivers on the size factor front as its weighted-average market cap stood at $9.65 billion as of October 11. It should be mentioned though that the fund does have exposure to the large-cap echelon, with 86 names valued at more than $10 billion accounting for around 30% of the assets.
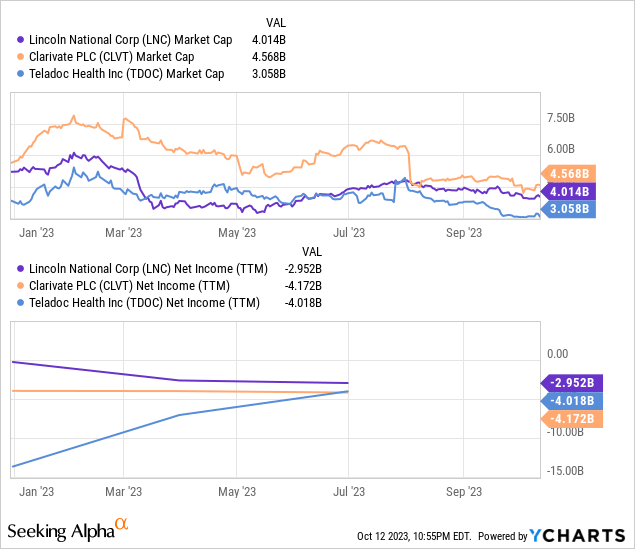
Next, the earnings yield is on the expensive side, and this is an issue. Even though energy and financials significantly contributed to the figure (i.e., companies like Southwestern Energy (SWN), New York Community Bancorp (NYCB), etc.), 4.4% is too small for the current environment. This is even below the 10-year Treasury yield of 4.69% (as of writing this article), which implies that in the event of the bond market sell-off resuming amid, for instance, a fresh wave of inflation fears, smaller-yield equities will suffer again. Next, rather surprisingly, the iShares Core S&P 500 ETF (IVV) offers an about 4.54% EY. Of course, there are a few detractors that skew the figure. For example, Lincoln National Corporation (LNC), Teladoc Health (TDOC), and Clarivate (CLVT) have deeply negative figures.

So with them removed, the metric would go up to around 4.7%, which is again not strong enough for my taste. Price/Sales of almost 5.4x is also telling.
Next, about 50% of the fund’s portfolio is made up of companies with a D+ Quant Valuation rating or lower (as of October 11); those with relatively attractive value characteristics account for about a fifth. Again, this is insufficient.
Another disappointment is quality. The essential point to understand is that mid-cap portfolios almost always trail their large-cap counterparts when it comes to the profitability factor. And SCHM is hardly an exception. It has only an about 74% allocation to stocks with a B- Profitability grade or higher, a mid-single-digit Return on Assets, and a Return on Equity in the low 10s, which is not attractive enough. I would prefer an at least 80% allocation, ROA closer to 10%, and ROE around 20%.
As I mentioned earlier, there is something to appreciate about growth. Truly, the weighted-average figures look robust, at least on the top and bottom line levels, partly thanks to such companies as Norwegian Cruise Line Holdings (NCLH), the main contributor to the WA revenue growth rate, and Celsius Holdings (CELH), which has the highest EPS growth rate in the entire portfolio. But in this case, assuming interest rate risks, a Buy rating cannot be based on a growth factor alone.
Investor Takeaway
SCHM is one of the cheapest ETFs in the mid-cap blend sub-class. Below are the seven funds with an expense ratio below 5 bps. After a few cuts, like the one in 2012, SCHM now has just 4 bps.
Seeking Alpha
This is definitely a solid advantage. To corroborate, let us look at its performance over the February 2011-September 2023 period compared to MDY and IVV.
| Portfolio | SCHM | IVV | MDY |
| Initial Balance | $10,000 | $10,000 | $10,000 |
| Final Balance | $32,370 | $42,499 | $31,747 |
| CAGR | 9.72% | 12.10% | 9.55% |
| Stdev | 17.40% | 14.44% | 17.37% |
| Best Year | 36.28% | 32.30% | 33.06% |
| Worst Year | -17.06% | -18.16% | -13.28% |
| Max. Drawdown | -29.57% | -23.93% | -29.63% |
| Sharpe Ratio | 0.57 | 0.8 | 0.56 |
| Sortino Ratio | 0.85 | 1.26 | 0.84 |
| Market Correlation | 0.96 | 1 | 0.95 |
Created using data from Portfolio Visualizer
MDY has an expense ratio of 23 bps. It is hardly surprising that SCHM was ahead of it, with a slightly stronger annualized return and also higher Sharpe and Sortino ratios. However, the problem here is that neither MDY nor SCHM were capable of outperforming IVV.
All in all, we see SCHM scoring nicely against certain indicators, but equities with characteristics that I favor most in the current environment are underrepresented. SCHM might be a good Buy, but this is not an appropriate moment to consider it.
Read the full article here


