Introduction
Effective December 15, 2023, the Index tracked by the SPDR S&P 500 Value ETF (NYSEARCA:SPYV) will reconstitute, resulting in significant changes similar to last year when Microsoft (MSFT) and Amazon (AMZN) joined as two of the Index’s top holdings. Therefore, the purpose of this article is to discuss the changes slated for next month, how they will drastically impact SPYV’s valuation, and identify other value ETFs that might be better core value holdings. In addition, this article offers a summary of 1-10Y returns for 50 large-cap value or dividend ETFs, and after reviewing, I think you’ll agree that while SPYV is undoubtedly solid, it’s not the best long-term choice. I look forward to taking you through the numbers in detail below.
SPYV Overview
Strategy Discussion
SPYV tracks the S&P 500 Value Index, which, according to its methodology document, measures the performance of large-cap U.S. stocks fully or partially categorized as value stocks, as determined by style scores. I underlined the above because the goal of S&P Style Indices is not to classify a stock as either value or growth perfectly, but instead to divide the total market capitalization approximately equally into value and growth Indexes. The process relies on three screens for each factor:
S&P Dow Jones Indices
All factors are backward-looking, with no consideration for analysts’ future estimates. More importantly, even though we’re only considering the value side today, we need to consider the growth scores, too, as they help differentiate a stock’s style. For example, if a stock has excellent value factors but is also up substantially over the last twelve months, it still might have more weight in the Growth Index. Conversely, traditional growth stocks with poor recent performance might enter the Value Index. That’s what happened with Microsoft and Amazon last year, but with their excellent year-to-date returns, it’s reasonable to believe a reversal is in order.
SPYV Basic Features
The following table includes some basic information about SPYV and three market-cap-weighted alternatives you might find helpful. As shown, SPYV’s 0.04% expense ratio matches the iShares Morningstar Value ETF (ILCV) and the Schwab U.S. Large Cap Value ETF (SCHV), and it’s by far the largest, with $15.7 billion in assets under management. The JPMorgan U.S. Value Factor ETF (JVAL) is another, better-diversified choice, with 10% less concentration than SPYV in its top ten holdings.
The Sunday Investor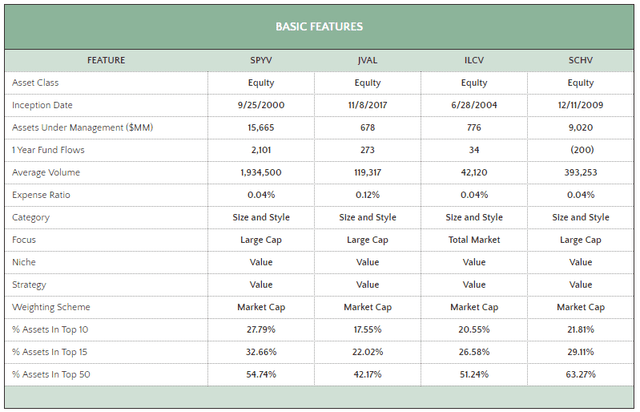
SPYV Top Holdings and Sector Exposures
SPYV’s top ten holdings are below, totaling 27.94% of the portfolio. Add Meta Platforms (META) to the list of previously-categorized growth stocks that have had a positive impact on the ETF this year. Microsoft, Meta Platforms, and Amazon are up 45.29%, 159.14%, and 63.10% through November 1, 2023. Given the price momentum screen, I doubt these will be prominent holdings come December.
State Street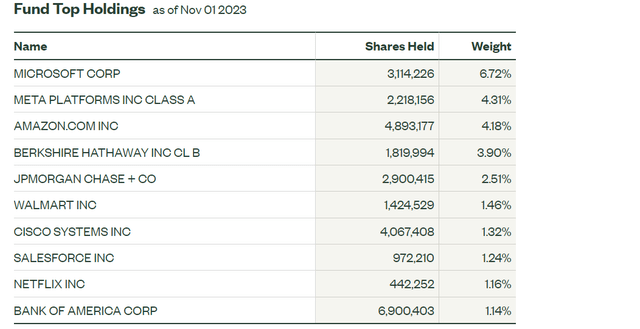
Next, let’s evaluate SPYV and these alternatives by their sector exposures. I find it interesting how different these exposures are, given how each attempts to capture the “value” portion of the large-cap segment. With the addition of Microsoft last December, SPYV has 18.59% allocated to Technology stocks compared to 10.85% and 9.98% for ILCV and SCHV. Meanwhile, JVAL has 25.42% exposure.
Morningstar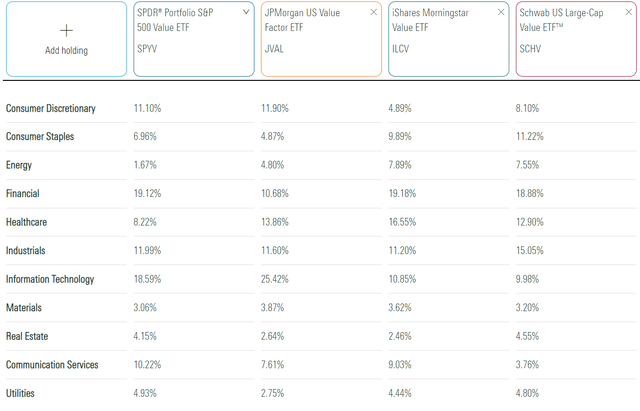
However, SPYV is still well-balanced. No sector accounts for more than 20% of its portfolio, and while Energy exposure is low at 1.67%, it does take some risk off the table. As for potential changes in December, we can preview them by examining year-to-date returns for State Street’s Select Sector ETFs, as follows:
- Communication Services (XLC): 35.79%
- Technology (XLK): 32.65%
- Consumer Discretionary (XLY): 18.57%
- Industrials (XLI): 1.37%
- Energy (XLE): 0.00%
- Materials (XLB): -0.70%
- Financials (XLF): -4.06%
- Health Care (XLV): -7.21%
- Consumer Staples (XLP): -7.26%
- Real Estate (XLRE): -8.13%
- Utilities (XLU): -13.32%
Given these discrepancies in returns, we could see an increase in Utilities, though, with relatively small market capitalizations, the change might be immaterial. However, we can expect a decrease in Communication Services, Technology, and Consumer Discretionary, as META, MSFT, and AMZN are the key holdings in those sectors. This should bring SPYV’s exposures more in line with ILCV and SCHV for 2024.
Performance Analysis
Boosting exposure to three of the Magnificent Seven stocks proved successful in 2023. According to the total returns and return-to-risk tables below, SPYV is up 5.71% YTD through October. JVAL and ILCV recorded small gains of 2.34% and 1.11%, while SCHV declined by 3.80%. Schwab’s value ETF is consistently the weakest performer.
The Sunday Investor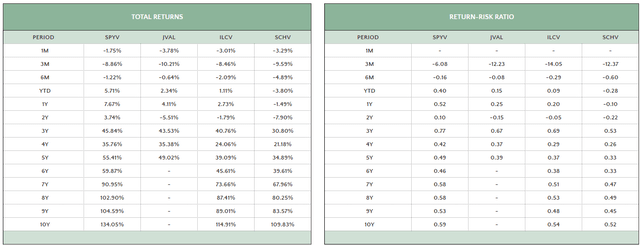
Still, SPYV’s returns and risk-adjusted returns are consistently better than the three alternatives. Still, when we consider some multi-factor ETFs like the Vanguard Value ETF (VTV), the iShares Russell 1000 Value ETF (IWD), and the Vanguard Mega Cap Value ETF (MGV), SPYV looks more average. Due to its index changes last year, it’s still the best performer year-to-date. However, over ten years, VTV and MGV outpace SPYV by 3.69% and 9.90%. Risk-adjusted returns were also better.
The Sunday Investor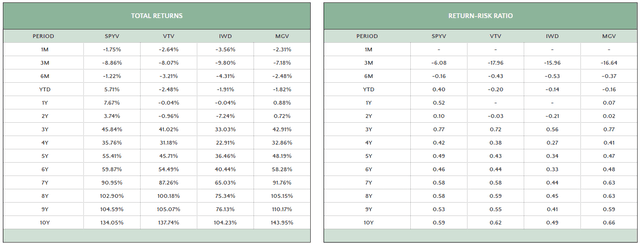
Lastly, consider SPYV’s performance against 49 other large-cap value ETFs, sorted by ten-year total returns across two tables. Most have a value or dividend focus, but I made some exceptions. For example, I included the Pacer US Cash Cows 100 ETF (COWZ), even though its FactSet classification indicates it’s a multi-cap blend fund. This list is not comprehensive, as there are at least 30 others not included. However, I want to highlight the performance of competing ETFs you might not have considered and see how SPYV stacks up.
The Sunday Investor The Sunday Investor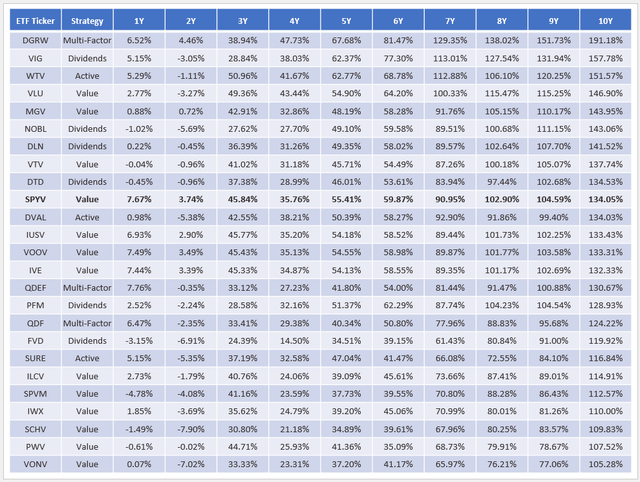
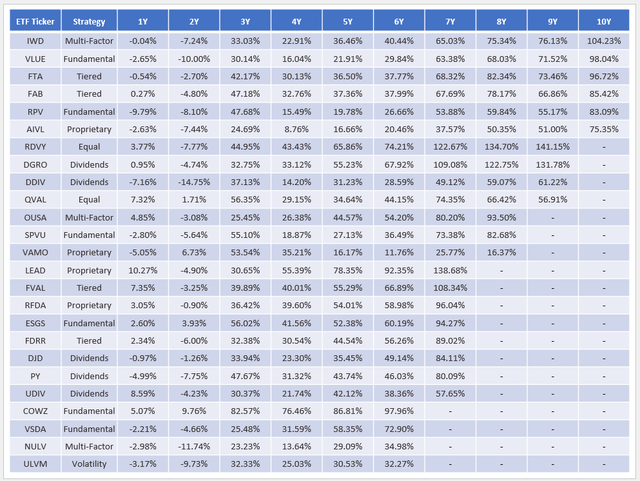
SPYV ranks #10/31 on ten-year returns, but several dividend funds outperformed, namely the Vanguard Dividend Appreciation ETF (VIG) and the ProShares S&P 500 Dividend Aristocrats ETF (NOBL). Also, the WisdomTree U.S. Quality Dividend Growth ETF (DGRW), a multi-factor fund that includes dividend screens, was #1 with a 191.18% total return. It’s evidence that other ways exist to define “value” besides the traditional three used by SPYV. For example, dividends reduce risk by returning cash to shareholders, and companies that consistently pay dividends typically have balance sheets in good working order. The Vanguard Value ETF (VTV) is another choice with a solid ten-year record, though it hasn’t performed well in the last year.
Over the last five years, SPYV’s 55.41% return ranks #8/50, which is outstanding. A few ETFs with favorable sector allocations outperformed over this period, including VIG, DGRW, COWZ, and the First Trust Rising Dividend Achievers ETF (RDVY). The latter two have higher turnover, but they are also options value investors might consider.
SPYV Fundamentals
The following table highlights selected fundamental metrics for SPYV’s top 25 holdings, totaling 41% of the portfolio. As comparators, I included VTV and DGRW to cover the value and dividend strategies.
The Sunday Investor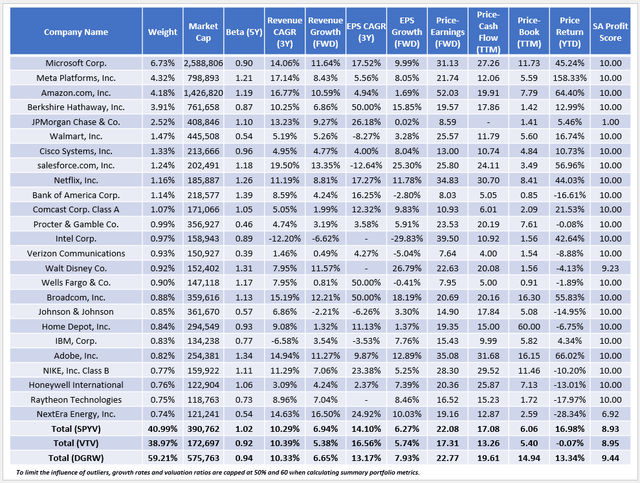
I have three observations:
1. SPYV and VTV’s net profit scores of 8.93/10 and 8.95/10 are slightly too low. For large-cap ETFs, I aim for a minimum score of 9.10-9.20/10, and DGRW’s 9.44/10 score could be why it’s outperformed. With last year’s reconstitution, the S&P 500 Value Index has already demonstrated it’s capable of adding traditional growth stocks like Microsoft, and I think it’s essential large-cap value investors emphasize profitability first and foremost. In the table above, note how nearly all the top 25 holdings have perfect 10/10 profit scores, but it’s the smaller stocks that weigh down the fund. For example, stocks in the Diversified Banks and Electric Utilities sub-industries have weighted average profit scores of 4.95/10 and 7.65/10. They comprise 8.52% of SPYV’s portfolio compared to 3.99% in the SPDR S&P 500 ETF (SPY).
2. SPYV has a 1.02 five-year beta, which is atypical for a large-cap value ETF. In contrast, VTV and DGRW have 0.92 and 0.94 five-year betas and might offer slightly better downside protection. DGRW’s superior profitability suggests investors are likelier to turn to its members in a market downturn. For VTV, safe-haven investors might prefer its 17.31x forward earnings valuation, which is about five points cheaper than SPYV.
3. While growth isn’t the focus of SPYV, its 6.27% estimated EPS growth rate looks average. It’s also less than half of the fund’s 14.10% three-year annualized EPS growth rate, and since this is true for all three ETFs, it’s evidence growth rates are slowing across the board. It’s good news for value investors, but be mindful of how not all value ETFs are created equal. VTV is consistent and avoids the Magnificent Seven stocks, which lowers its growth potential and valuation ratios. DGRW is more growth and quality-oriented, indicating higher exposure to these stocks. Finally, SPYV is the least consistent of the three. Its screens are backward-looking and may not reflect the current environment well.
December Reconstitution: What To Expect
Recall how S&P Style Indices are created to divide the market capitalization of the S&P 500 Index into growth and value. To support my predictions, I’ve compiled rankings for the six used by S&P Indices for all S&P 500 stocks. Below are the top ten, ranked on a scale from 1-500, with a #1 ranking being most favorable.
The Sunday Investor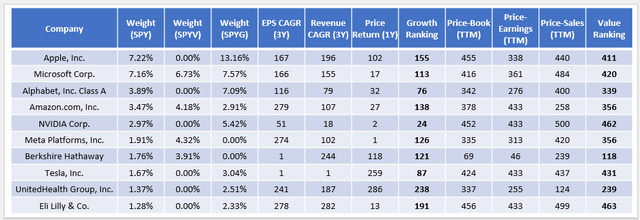
1. Apple is unlikely to move to the Value Index. Its 155/500 growth ranking indicates it’s around the top 30%, while high P/B and P/S ratios put it in the bottom 20%.
2. Microsoft will return to the Growth Index, as it scores highly on all three growth factors. In particular, its price return over the last year is 17th best, and its value ranking is below Apple. Therefore, Microsoft may be eliminated from the Value Index entirely, as it was before the 2021 reconstitution.
3. Alphabet is another stock that scores highly on growth at 76/100. Its 339/500 value ranking is also poor, and when taken together, I don’t anticipate any meaningful changes.
4. Amazon declined by 49.62% in 2022 but is up 64.37% in 2023. Trading at 71.54x trailing earnings, SPYV is likely to drop this stock next month.
5. Meta Platforms has a similar average growth and value ranking as Amazon, so I expect it will also be removed from SPYV. It’s also the top-performing S&P 500 stock over the last year, so keeping it in a Value Index makes little sense.
Microsoft, Amazon, and Meta Platforms combine for 15.23% of SPYV, and their allocations should be substantially reduced, possibly to zero, next month. Five other stocks that have good growth rankings and poor value rankings are Salesforce (CRM), Netflix (NFLX), Broadcom (AVGO), Adobe (ADBE), and NIKE (NKE), totaling 4.09% of SPYV. On the other hand, new entrants could include Chevron (CVX) and Bristol-Myers Squibb (BMY), two stocks down 16.66% and 33.98% over the last year but with trailing P/E’s of just 11.06 and 12.97x.
Investment Recommendation
SPYV is an above-average performing large-cap value ETF with a low 0.04% expense ratio. Its long-term returns are stronger than other market-cap-weighted value funds but not as good as some dividend-oriented ETFs. SPYV’s quality is slightly suspect, too. Its 8.93/10 profit score is slightly below my minimum, and ETFs like DGRW have served long-term investors better.
I predict Microsoft, Amazon, and Meta Platforms, three stocks responsible for SPYV’s outperformance this year, will exit the S&P 500 Value Index in one month. If accurate, I suggest switching to VTV now, as its fundamentals and composition will be similar, and its long-term track record is equally strong. You’ll benefit from owning a true “core” large-cap value ETF that consistently produces a portfolio of low-beta stocks trading at attractive valuations and can always use more active complementary ETFs to shift gears when necessary. That’s the easier approach, so I’ve assigned only a “hold” rating to SPYV. I look forward to continuing the discussion in the comments section below and plan on revisiting it later this year when the actual changes come in.
Read the full article here


