In our last two articles, we explained why the two month price decline since July is probably the start of another bear market. The key reason was the new highs in long-term interest rates, the importance of which was explained in the first article, The Warren Buffett Bear Market.
In the second article, we outlined why market sentiment was conflicting in its signals – some indicators where pointing to a bull market, while others to a bear market. So we wrote:
“This conflict must resolve and we’ve found that it’s best not to act or have an opinion at moments like this. One should wait until the investment picture clarifies and experience tells us it will, and relatively soon. In the meantime, we believe investors should hold their positions and not add or change anything.”
After writing this, we noticed we failed to provide guidelines on what they’re waiting for? What “investment picture” has to clarify? This article addresses that. Clarification in this situation is based on a fundamental technical concept called divergence. So, this third article is really an extension or continuation of the first two.
By the way, don’t let the simplicity of what follows dissuade you. People often think they have to analyze twenty factors to determine what the market’s going to do. This is wrong; it’s normally something simple.
Market Divergence
“Divergence” has been used as a major indicator of coming bear markets since 1900. In fact, the original Dow Theory was based on it. A divergence occurs when one major price index hits new highs, or double tops, while another doesn’t. The longer the divergence (time wise) the more reliable the signal.
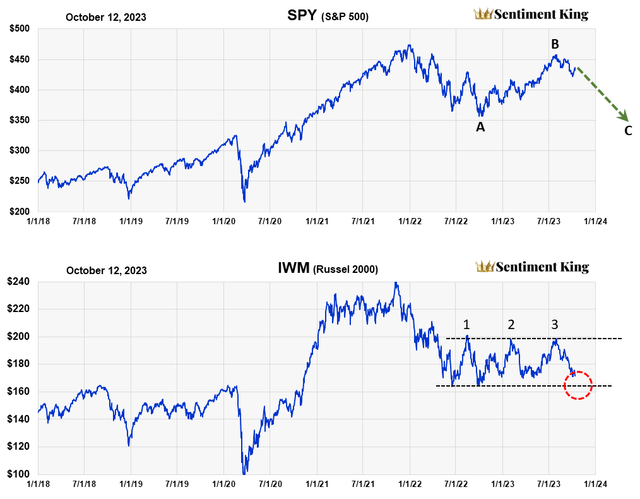
Comparing the S&P 500 (SPY) with the Russell 2000 (IWM) Over Last Five Years (The Sentiment King)
Using two large etfs as proxies – SPY and IWM – this chart compares the S&P 500 against the Russell 2000. Both are broad based price indices that track completely different types of companies. The S&P 500 tracks the large, capitalized stocks while the Russell 2000 tracks the much smaller companies.
We think these two indices show the important divergence going on in the market today and is similar to what happen in the bear market of 1972-74. Then, the divergence was also between the small cap stock indexes and the S&P 500, which reflected the nifty fifty stocks. The nifty fifty then is similar to the investor focus today in the magnificent seven.
The price divergence in the chart is obvious. While the S&P 500 effectively double topped in July, and is still relatively close to its all-time highs, the Russell 2000 has been in a trading range and is close to last year’s bear market lows. The red circle shows this.
It’s our opinion that if the Russell 2000 breaks below last year’s bear market lows and gets to 160 on IWM, then the Russell 2000 will have confirmed the start of a new leg down of a larger bear market.
And if the Russell 2000 breaks down, the S&P 500 should breakdown too and reach last year’s lows (point C), as diagrammed. We forecast this ABC pattern and a second bear market nine months ago as the most probable scenario: Market Sentiment And A Bear Market Elliot Wave Flat. We still think it’s the most probable outcome.
Three Strikes You’re Out
We also marked with numbers the three times the Russell 2000 tried to penetrate the upper band of its trading range and failed. To us, this failure provides added confidence that the Russell 2000 will break below the lower band and signal a bear market – and do it relatively soon.
A Closer Look At the Situation
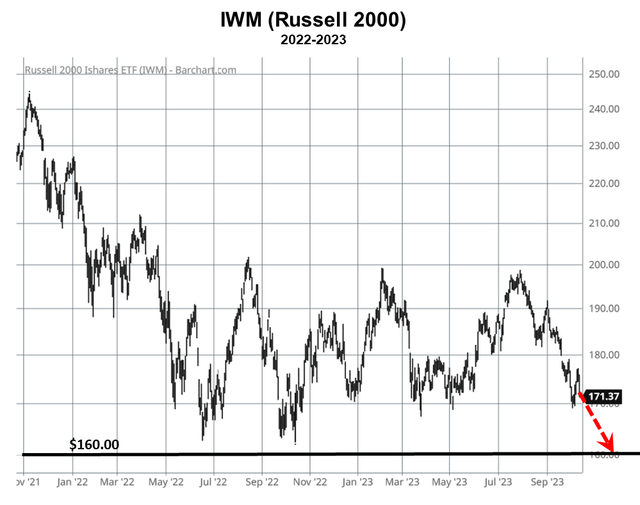
Two Year Daily Chart of IWM (Barchart)
This chart is the daily price of IWM and clearly shows how close it is to the breakdown target of $160. It would only take a decline of 6.5% to confirm that the Russell 2000 was in another bear market.
If the breakdown occurs, the price target for IWM is $140. That would be a decline of 30% from the July high of just under $200. This is based on our January forecast of two bear markets of about equal size. A 30% decline from a high of $200 takes us to $140. This low should occur sometime next Spring.
If the S&P 500 returned to last year’s low, that would be an overall decline of around 25% from its July high.
How to Know “If” or “When” This Thesis is Wrong?
Remember, we’re not telling investors to sell their positions. We wrote that investors should hold current positions but not add any – and to “wait.” Since the Russell 2000 is so close to the lower end of its one year trading range, this thesis allows an investor to act on the expectation of a bear market before it actually declines 20%, which is the normal definition of a bear market. It assumes the breakdown below the trading range would be the start of a major trust down for the entire market, including the S&P 500.
How will we know if this is wrong? The obvious answer is if IWM doesn’t break down and instead moves back up to the top of the trading range. That would be the fourth effort to punch through and it’s a long standing principle that the fourth time seldom fails.
However, we see little risk in holding one’s position and, if the Russell 2000 breaks below its lower trading range, then take bear market precautions.
Read the full article here


