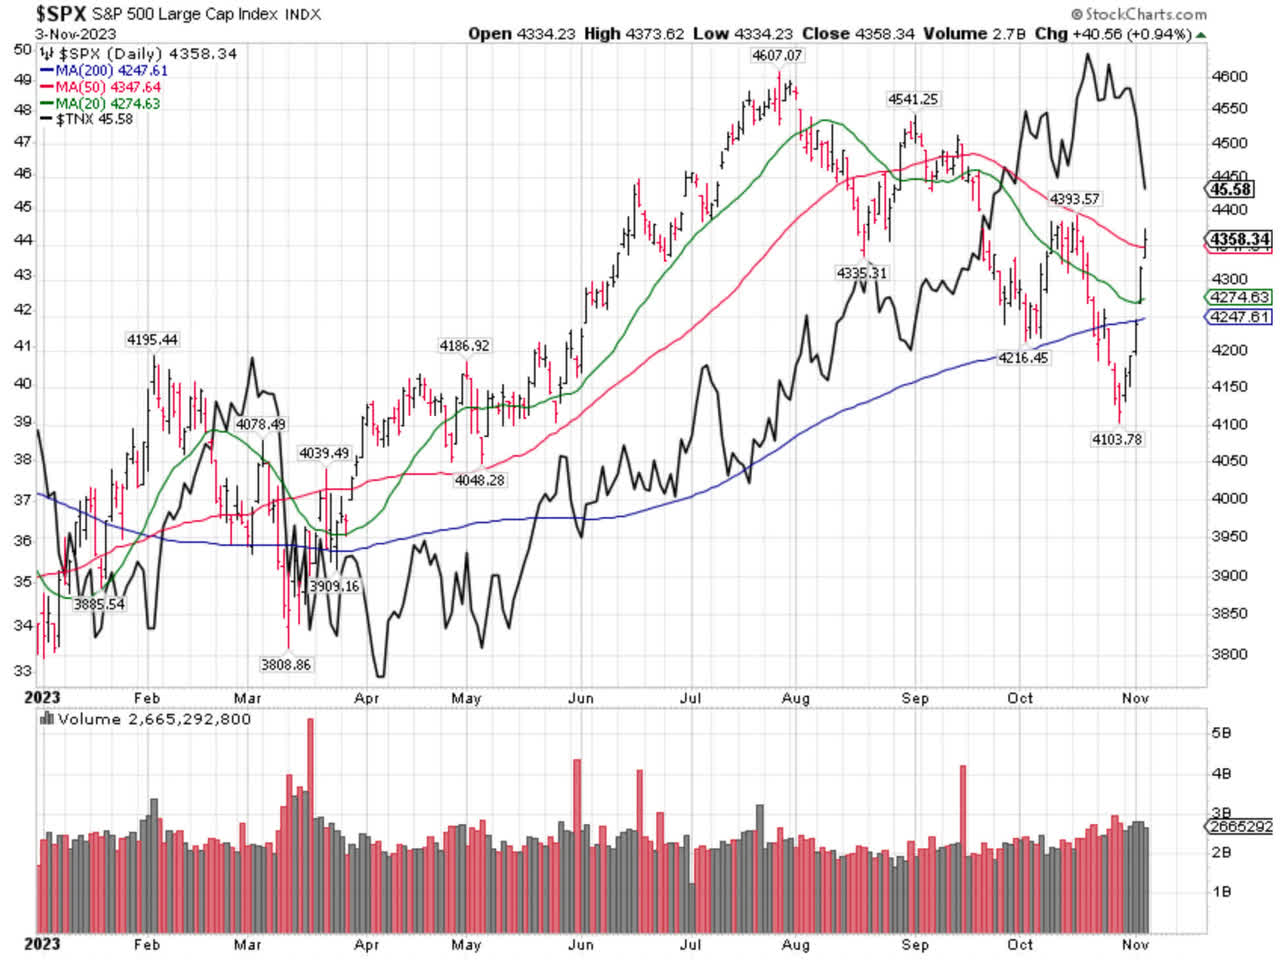
The surreal correlation between Treasury rates and stock index futures, that had been intensifying in September and October, played its role – in a positive manner for a change – with both stock index and Treasury futures registering sharp rebounds.
The 10-year Treasury yield dipped below 4.50% intraday on Friday, on the news of the cooler October payrolls report, extending further drops from Jerome Powell’s FOMC press conference, where he for once sounded a bit more in tune with the present economic reality.
A wink from the Fed Chairman to the bond market counts for a lot – in this case, trillions of dollars.
Graphs are for illustrative and discussion purposes only. Please read important disclosures at the end of this commentary.
A 1% move in the S&P 500 is worth roughly $400 billion in market value, and we were up almost 6% last week. There are over $33 trillion in U.S. Treasury securities, but also mountains of debt that use them as a reference pricing mechanism (the total value of all bonds in the U.S. is bigger than the total value of all stocks). The move last week was worth well over $5 trillion in market value in both stocks and bonds.
I think the lows in the stock market for 2023 are already in, but since there are no guarantees, the main factor that can override that positive setup is the Israel-Gaza situation, if it goes regional. I have no way of predicting that at present, but I sure know it can happen.
What happens in 2024 depends on whether we get a soft or hard landing in the economy. I must point out that the difference between a mild recession or a soft landing is not all that big, but it is too early to speculate on what will happen in 2024.
If the housing market remains strong and interest rates drift lower because of falling inflation and the shortage of workers, it is still possible we will get a soft landing.
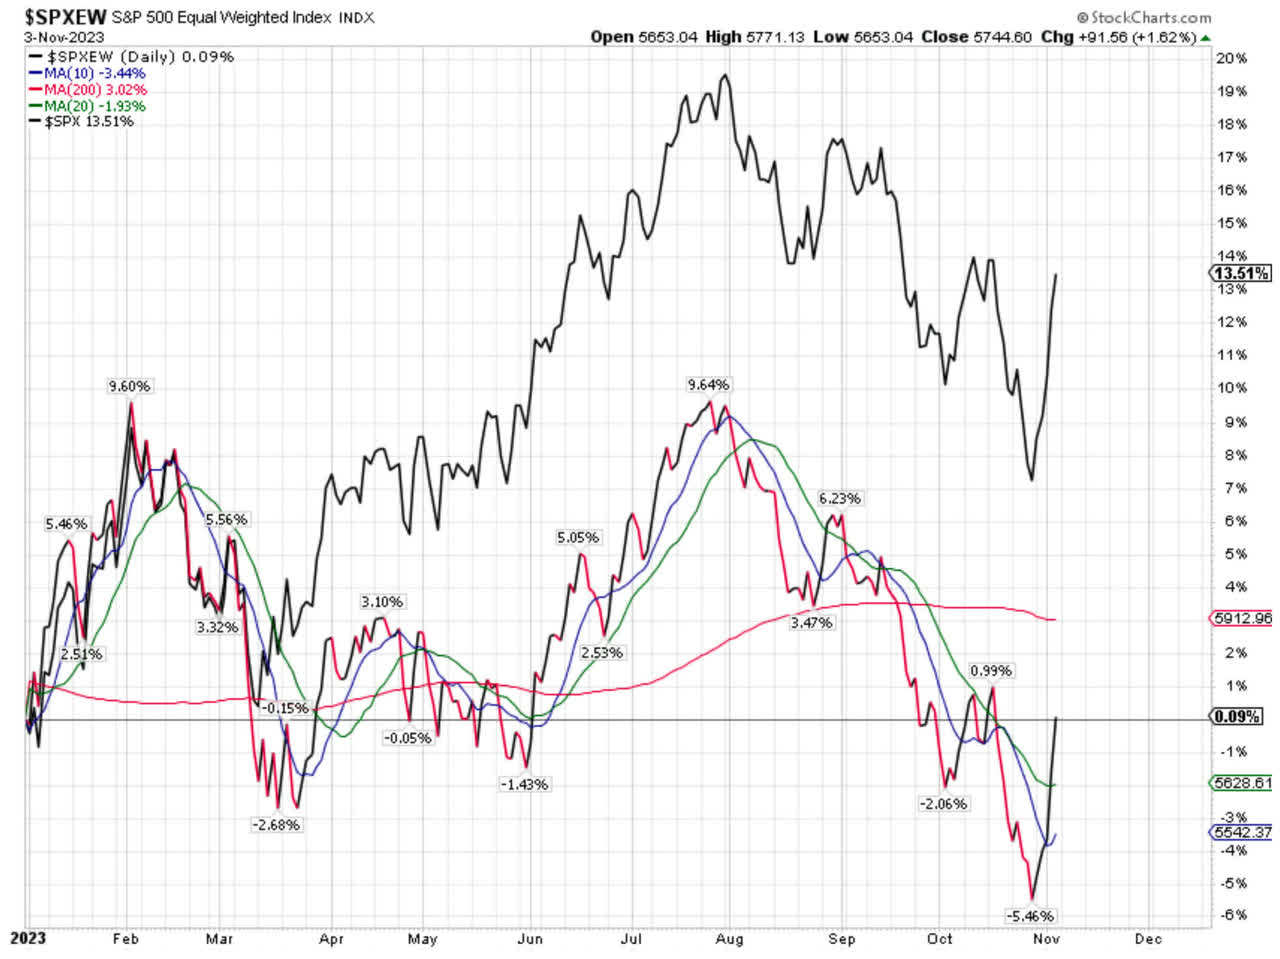
If we get a soft landing, the terrible market breadth situation that has been causing extreme divergences between the S&P 500 Equal Weight Index and its more famous market cap-weighted first cousin, the S&P 500 Index, will get better.
Looking at those two is like looking at two completely different markets, where the components are 100% identical, just given different weights.
In the S&P 500, tech mega caps have been holding the index hostage, with a handful of stocks counting as much as several hundred of the smallest stocks in the S&P 500.
In late October, the SPXEW bottomed out, down 5.5% for the year, while on that same day the SPX was up over 7% for the year. Because people are chasing mega-cap tech stocks on the rebound, the differential between the two indexes has widened to 13.42%!
Graphs are for illustrative and discussion purposes only. Please read important disclosures at the end of this commentary.
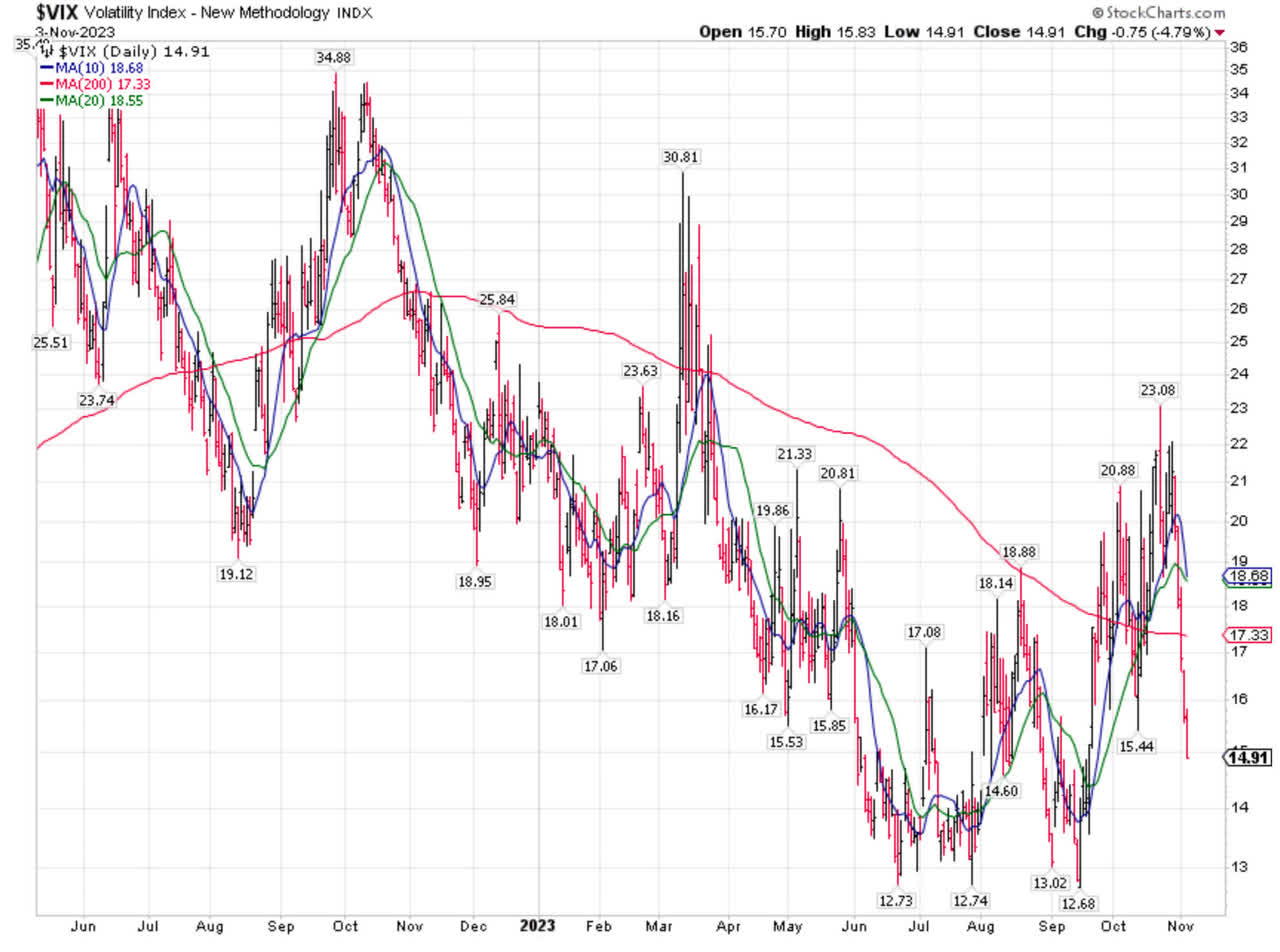
Furthermore, we have a sizable decline in the VIX from an elevated level (for present day standards) from its late October highs.
Because of this massive shorting of options due to the explosion of zero days to expiration (0DTE) option, i.e., options that are listed in the morning and expire at the end of the day, the VIX has not had the spikes it historically does.
It doesn’t mean it cannot spike like the old days, but it simply means it has not happened in this cycle. The VIX has declined dramatically over the past week, which is consistent with an intermediate-term bottom similar to the one we saw in October 2022.
Graphs are for illustrative and discussion purposes only. Please read important disclosures at the end of this commentary.
All content above represents the opinion of Ivan Martchev of Navellier & Associates, Inc.
Disclosure: *Navellier may hold securities in one or more investment strategies offered to its clients.
Disclaimer: Please click here for important disclosures located in the “About” section of the Navellier & Associates profile that accompany this article.
Original Post
Editor’s Note: The summary bullets for this article were chosen by Seeking Alpha editors.
Read the full article here
