Modern portfolio theory holds that if you can diversify your portfolio between uncorrelated assets with positive expected returns, you’ll earn a higher return for any given level of risk. For example, if you have two assets that have zero correlation in the long run but similar expected returns, splitting your money between them equally should earn you a 1.4x higher return for any given level of risk. In reality, different asset classes are often correlated in times of economic stress so you generally won’t realize all of your increased expected value in reality. However, diversification is the closest thing finance has to a free lunch, so you should still generally diversify as much as possible, both between asset classes and sectors of the stock market. Also, because so many market participants diversify so widely, asset classes will sometimes have correlations that are driven by margin calls, hedge fund sentiment, or rumors. You can often pick up some nice value investments off of these. With this in mind, let’s dive into some situations where you can use correlations to either reduce your risk or increase your return.
1. Bonds Are Now Offering Low-Correlation Returns
First, for the most obvious example:
Stocks and bonds generally don’t have much correlation, so investing in both is a classic move to earn a better risk-adjusted return. Going back to 1993, the S&P 500 (SPY) and US bonds have a correlation of roughly 0.12. Investing in both in equal proportion got you about 20% more return for any given level of risk, which is roughly in line with the theory. Bonds weren’t very good investments in the 2010s because the yields were so low, but comparing the aggregate bond index yield of ~5.7% now and the expected inflation rate of ~2.4% gives you a roughly 1.9% expected return after inflation and taxes (at a 25% tax rate). If you’re in the top tax brackets, you might do better in municipal bonds which are in many cases yielding over 5%, earning 2.5% or better in real return.
This is a much different proposition than earning 2% after tax when inflation was expected to be 2% throughout much of the 2010s. Bonds aren’t going to make you rich here, but investors who haven’t been used to earning any return in excess of inflation in fixed income and haven’t wanted to invest in bonds might want to get reacquainted. History tells us that the broad stock market will sell off 50% or more on occasion, making either cash or bonds look a rather attractive way to dilute this risk.
2. Some Stocks Do Better Than Others When Rates Rise
While we’re on the topic of rising rates, investors in the zero-rate world of the 2010s turned to all kinds of alternatives to bonds. In the era between the 1970s inflation shock and the 2008 global financial crisis, aggregate bond yields averaged about 6%, leaving plenty of compensation for investors after inflation.
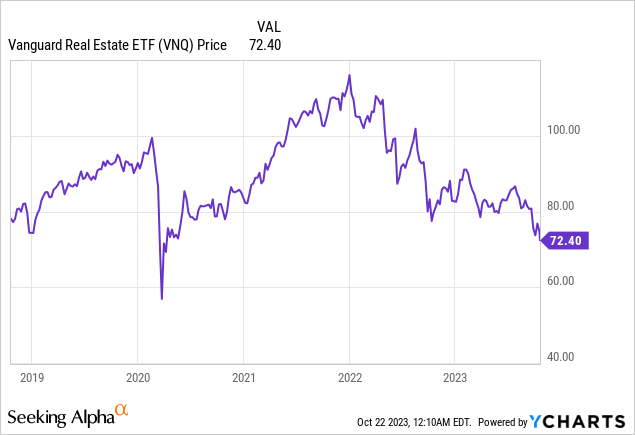
After 2008, central banks began their infamous zero-rate policy that lasted through the pandemic. Investors increasingly bid up alternatives to bonds such as high-yielding dividend stocks (VYM), rental real estate, and REITs (VNQ). Now, many of these investments have gotten hosed.

REITS have had their second bad year in a row, with the most recent selloff accelerating with the huge rise in interest rates.

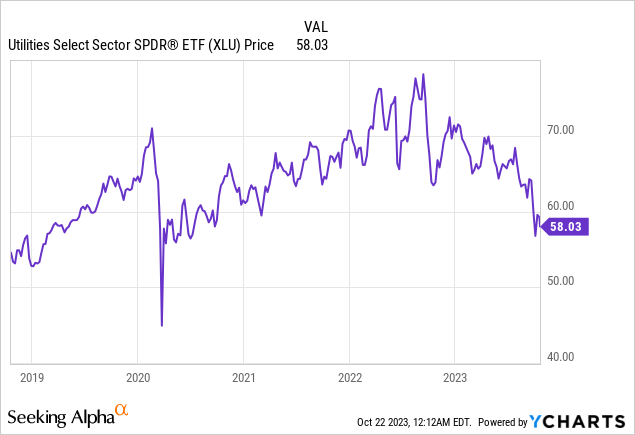
Supposedly rock-solid utilities (XLU) have been demolished this year as interest rates have continued to rise.
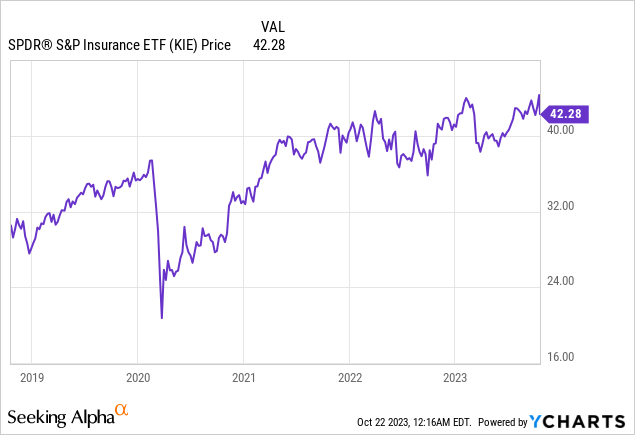
Insurance companies are also rather boring and safe but have the opposite exposure to higher interest rates that REITs and utilities have. The insurance sector (KIE) is up this year, and you can find some strong dividend payers among its holdings.

This is why many professional institutional investors use software to track their portfolio correlation to interest rates, oil prices, or any other factor of their choice and invest in different industries for balance. For example, Walmart (WMT) is up about 19% over the past year as consumers struggling with inflation stop shopping at Target (TGT) and start coming back to Walmart. For these reasons, owning some Walmart is a great way to balance out other holdings in your portfolio, even if the expected return from owning Walmart isn’t likely to be as high as the overall market. The tobacco business is another business that is generally correlated with nothing, so small holdings in Altria (MO) and Philip Morris International (PM) should help your portfolio move more independently from the market.
The overall index tends to be weighted more towards tech, which is its own beast. But if you’re willing to underweight tech a bit, you can get a much more diversified portfolio. The energy sector had become the mirror of tech over time, becoming an increasingly small part of the index. But those who noticed the strong negative correlation that formed between energy stocks and tech during the pandemic would have picked up on the value right away. Now the index has moved back closer to balance, but balancing your tech-heavy ETFs with some energy stocks remains a good way to hedge against inflation.
We’ve talked about what to do here, but it’s also worth talking about what not to do. If you pursued a strategy of buying all of the highest-yield stocks on the market just because they’re the highest-yielding stocks, you would have inadvertently built a large bet on interest rates continuing to go down. Unknowingly making a bet like that makes it harder to manage your risk and cut your losses because most everything you own is correlated to the same risk factor.
3. Correlations Can Help You Find Value
Finding correlations isn’t rocket science. If you use Seeking Alpha’s watchlist to track a large number of stocks, you’ll notice that many groups of stocks tend to trade closely alike. For example, speculative meme companies tend to rise and fall at the same time. Big Tech tends to trade together. Energy stocks tend to trade together. Banks tend to trade together.
You can also use free tools like Portfolio Visualizer to track the long-term correlation of certain tickers. There are other free tools like buyupside.com and stockcharts.com that offer free correlation tools. For example, we can see here that Apple and Microsoft have a correlation coefficient of 0.977 over the past 5 years, so if you think one business is better than the other it’s somewhat likely the market has overlooked it.
Sometimes big quant funds or hedge funds will make stocks have weird correlations. If 15 stocks that are all owned by the same hedge fund get simultaneously crushed because they get a margin call, then it might be a buying opportunity.
Some examples of weird correlations:
- During the pandemic, all the work-from-home stocks would trade one way, and the reopening stocks like energy stocks and airlines would trade the other way. Sometimes the NASDAQ would be up like 1.5% in a day because there was a COVID surge in Los Angeles or somewhere, and the Dow and the energy stocks would be down 1% on the same day. This led to certain stocks trading purely on hype and way out of line with any educated guess of what their fundamentals were. Zoom (ZM) had a bigger market cap than Exxon Mobil (XOM) at one point.
- Right now, the biggest craze on Wall Street is anything having to do with Ozempic, the weight loss drug. Certain stocks are getting pummeled because there are rumors that consumer demand is down because of Ozempic, and other stocks are seeing huge rallies. This is compounded by the tendency of CEOs not to take responsibility for their own execution and blame external factors like Ozempic and COVID instead. While I’m sure a lot of analysts in Manhattan are on Ozempic, these moves are silly in the context of 330+ million people in the US. If anything, the Ozempic craze might be making some analysts look at the valuations of consumer staples companies and realize they’d been way too high for years. As an aside, I think the likelihood that hidden side effects come out over these “miracle drugs” is extremely high. Of course, nobody wants to eat healthy and walk 5 miles a day, they’d rather take drugs and try to get their insurance company to pick up the tab.
- Another interesting correlation I can point to right now is the correlation between oil prices and solar stocks (TAN). Intuitively here, we’d expect solar to do better when oil prices rise because the price of energy at any given time directly affects how attractive putting solar panels in is. Long-term, the correlation is roughly 0.2, which isn’t much, however. The correlation between the 10-year Treasury yields and solar stocks is about -0.25. This makes intuitive sense– solar stocks do better when energy is getting more expensive and worse when it costs more to finance new solar panels. These correlations can help put the huge moves in solar stocks in context– rising interest rates aren’t great for solar stocks, but higher energy prices are. The main solar ETF is TAN– TAN went down 6% on Friday alone. When you compare to earnings estimates down the road though, solar stocks like First Solar (FSLR) and Enphase Energy (ENPH) are rock-bottom cheap.
- If the situation in the Middle East heats up (as history shows it may), then energy stocks of all kinds are likely to benefit, while stocks like airlines will suffer.
Bottom Line
The average S&P 500 stock (RSP) is down about 3% this year off of already depressed levels at year-end 2022, while the broader S&P 500 is still holding onto gains made earlier this year from Big Tech. The situation is worse for bonds and small caps, which are both down more than 5%. However, there are some bright spots in stocks that aren’t heavily correlated with the broader market and some potential value in beaten-down stocks. Using correlations can help you in small part to be more intentional about your investments and earn better returns for less risk. As a value investor, it’s easy to curse the Wall Street algorithms that push stocks around in the short run, but you can use them to your advantage to get better prices for the assets you want and reduce your overall volatility.
Read the full article here


